SNTL Daily Chart........... Holding Well But It's
Post# of 2561

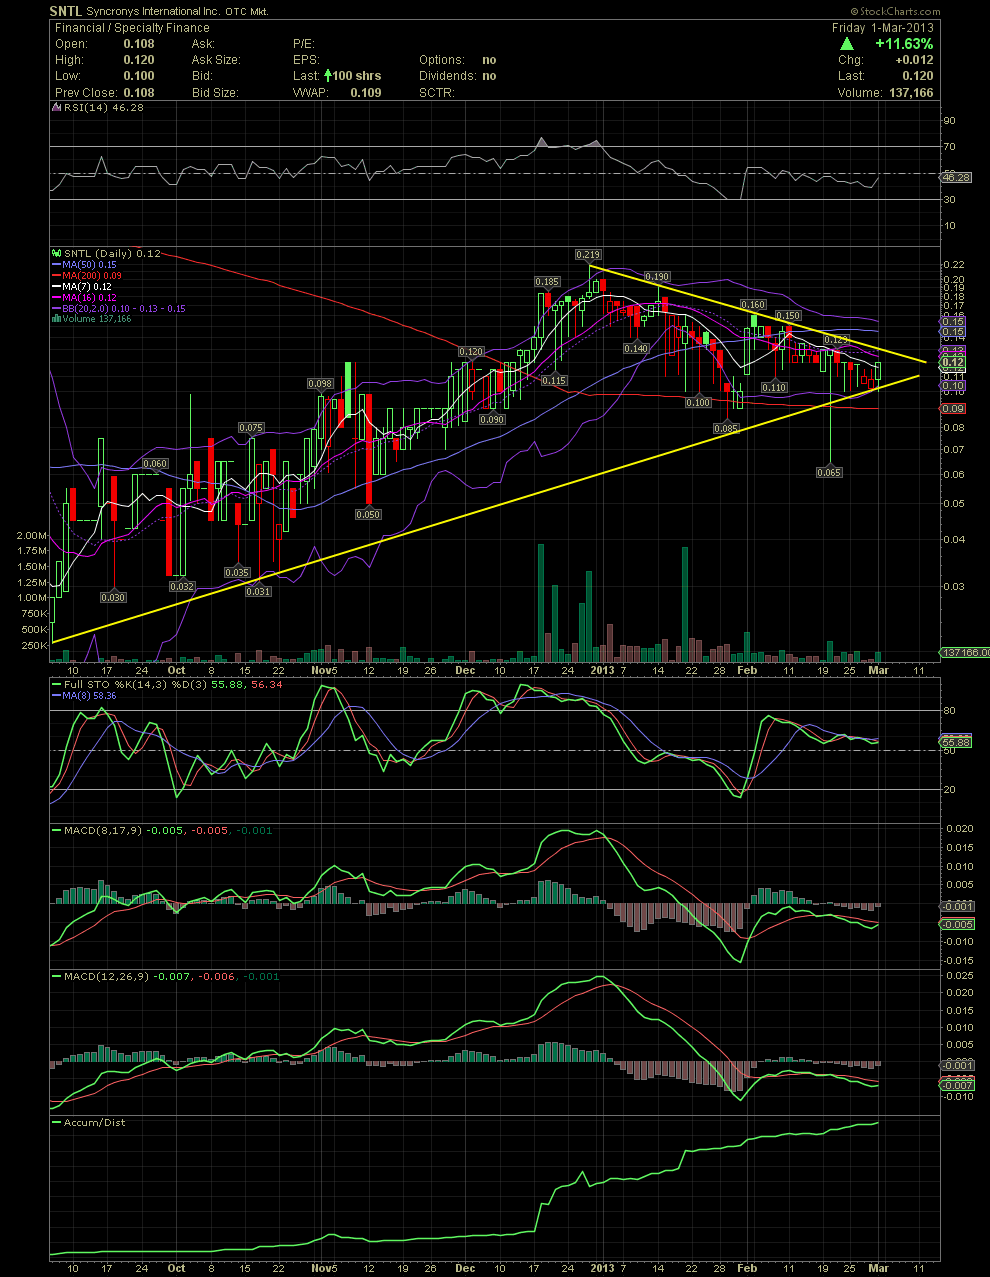
SNTL Daily Chart........... Holding Well But It's Time for a Bounce Up
SNTL has been holding the MA200 for some time now. With the exception of one day in February, SNTL has held its rising trend line which began in the .02s. The declining tops line began at .219 in late December. Friday's green candle and moving above the MA7 was the first close above it in over three weeks. A move and close above .13 would probably position the stock for a breakout to the upside. Imo that could happen as early as Mon/Tue. Some resistance points along the way would be .15, .16, .19 and .219. The FullSto and MACDs are ready for a crossover to the buy side but the aren't there quite yet. I'm liking this company though, so I'm hoping for some solid news from the company soon. GLTA

 (0)
(0) (0)
(0)