Gold, XAU, ABN.V - Technical Analysis and forecast
Post# of 1088
(Total Views: 697)
Posted On: 02/07/2022 12:22:20 PM
Gold, XAU, ABN.V - Technical Analysis and forecast ...........................
The constructive Gold chart pattern and XAU chart pattern in short term and long term charts, in conjunction with rapidly increasing volume, is a sign of an imminent uptrend with accelerating momentum, leading to an explosive breakout from the 2021 convergence as increasing number of investors flee to the resources sector amid persistently rising inflation.
With impending NI 43-101 Report on Justin gold project and possible sale, and with exploration program for Slocan Graphite project and Pringle North gold project anticipated to be released in April, upward pressure is building, eventually blowing the lid off a boiling kettle.
https://investorshangout.com/images/MYImages/...,Daily.jpg
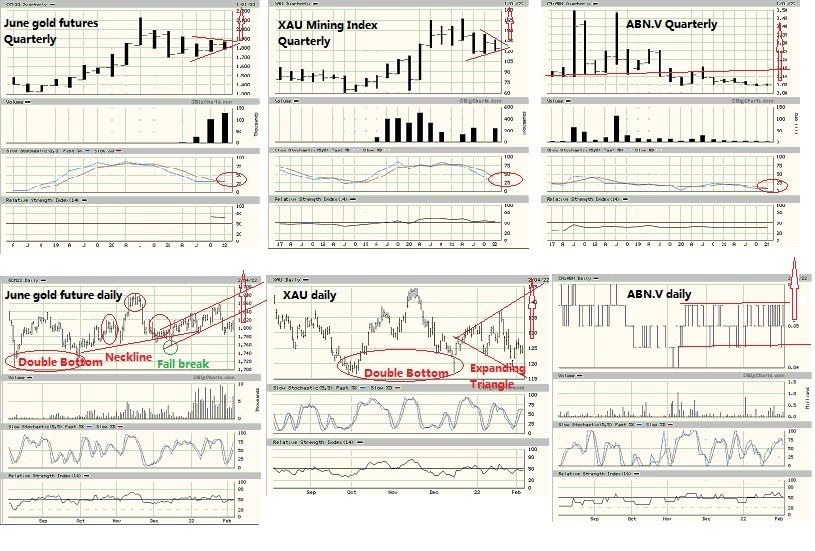
Short term daily charts: The constructive and bullish chart pattern in Gold and XAU forms a strong support base from which a bull market will be launched. RSI in ABN.V has risen over 50%, signalling bullishness and imminent sharp breakout over 5.5 cents from the prolonged side way formation.
June Gold futures daily
https://bigcharts.marketwatch.com/advchart/fr...=2&tim
XAU daily
https://bigcharts.marketwatch.com/advchart/fr...47&y=9
ABN.V daily
https://bigcharts.marketwatch.com/advchart/fr...ize=2&
Medium term Quarterly charts: Expect sharp breakout in Q2 in Gold and XAU Mining Index, triggering the start of a new and prolonged uptrend in mining stocks.
June Gold futures Quarterly (Q1 volume in June gold futures is increasing rapidly with January volume exceeding volume of previous quarter)
https://bigcharts.marketwatch.com/advchart/fr...2&x=52
XAU Quarterly (Volume in XAU Index started rising in January after a hiatus and inactivity in 2021, Stochastics Oscillator suggests an uptrend is imminent)
https://bigcharts.marketwatch.com/advchart/fr...=49&y=
ABN.V Quarterly (Volume in ABN.V is increasing, investors have loaded up 10 million shares of Aben in the past 3 months as the phenomenon of "one man's trash is another man's treasure" lingers on)
https://bigcharts.marketwatch.com/advchart/fr...e=2&x=
Long term Annual charts: The constructive and bullish daily Gold chart pattern and daily XAU chart pattern will lead to a strong breakout from the 2021 convergence, making new record highs over $2,100 and 230 respectively, supported by rapidly increasing volume.
June 2022 gold futures Annually (Volume in June gold futures in January already exceeds volume in the whole 2021)
https://bigcharts.marketwatch.com/advchart/fr...2&x=34
XAU Mining Index Annually (Volume in XAU Index started rising in January after a hiatus and inactivity in 2021. Based on the rate of increasing volume, 2022 volume could exceed 2020 volume of 1.3 million contracts)
https://bigcharts.marketwatch.com/advchart/fr...=49&y=
ABN.V Annually (ABN.V share price is undervalued, technically it should surge back above the Neckline of the 3-year Head&Shoulder formation back to 2018 trading range between 15 cents and 50 cents. )
https://bigcharts.marketwatch.com/advchart/fr...e=2&x=
(Display of above charts is ok, sometimes they do not display or display incorrectly due to website problem, try clicking them several times)
The constructive Gold chart pattern and XAU chart pattern in short term and long term charts, in conjunction with rapidly increasing volume, is a sign of an imminent uptrend with accelerating momentum, leading to an explosive breakout from the 2021 convergence as increasing number of investors flee to the resources sector amid persistently rising inflation.
With impending NI 43-101 Report on Justin gold project and possible sale, and with exploration program for Slocan Graphite project and Pringle North gold project anticipated to be released in April, upward pressure is building, eventually blowing the lid off a boiling kettle.
https://investorshangout.com/images/MYImages/...,Daily.jpg
Short term daily charts: The constructive and bullish chart pattern in Gold and XAU forms a strong support base from which a bull market will be launched. RSI in ABN.V has risen over 50%, signalling bullishness and imminent sharp breakout over 5.5 cents from the prolonged side way formation.
June Gold futures daily
https://bigcharts.marketwatch.com/advchart/fr...=2&tim
XAU daily
https://bigcharts.marketwatch.com/advchart/fr...47&y=9
ABN.V daily
https://bigcharts.marketwatch.com/advchart/fr...ize=2&
Medium term Quarterly charts: Expect sharp breakout in Q2 in Gold and XAU Mining Index, triggering the start of a new and prolonged uptrend in mining stocks.
June Gold futures Quarterly (Q1 volume in June gold futures is increasing rapidly with January volume exceeding volume of previous quarter)
https://bigcharts.marketwatch.com/advchart/fr...2&x=52
XAU Quarterly (Volume in XAU Index started rising in January after a hiatus and inactivity in 2021, Stochastics Oscillator suggests an uptrend is imminent)
https://bigcharts.marketwatch.com/advchart/fr...=49&y=
ABN.V Quarterly (Volume in ABN.V is increasing, investors have loaded up 10 million shares of Aben in the past 3 months as the phenomenon of "one man's trash is another man's treasure" lingers on)
https://bigcharts.marketwatch.com/advchart/fr...e=2&x=
Long term Annual charts: The constructive and bullish daily Gold chart pattern and daily XAU chart pattern will lead to a strong breakout from the 2021 convergence, making new record highs over $2,100 and 230 respectively, supported by rapidly increasing volume.
June 2022 gold futures Annually (Volume in June gold futures in January already exceeds volume in the whole 2021)
https://bigcharts.marketwatch.com/advchart/fr...2&x=34
XAU Mining Index Annually (Volume in XAU Index started rising in January after a hiatus and inactivity in 2021. Based on the rate of increasing volume, 2022 volume could exceed 2020 volume of 1.3 million contracts)
https://bigcharts.marketwatch.com/advchart/fr...=49&y=
ABN.V Annually (ABN.V share price is undervalued, technically it should surge back above the Neckline of the 3-year Head&Shoulder formation back to 2018 trading range between 15 cents and 50 cents. )
https://bigcharts.marketwatch.com/advchart/fr...e=2&x=
(Display of above charts is ok, sometimes they do not display or display incorrectly due to website problem, try clicking them several times)
 (0)
(0) (0)
(0)