MINE Daily Chart......... Link back to my MINE
Post# of 1276

MINE Daily Chart.........
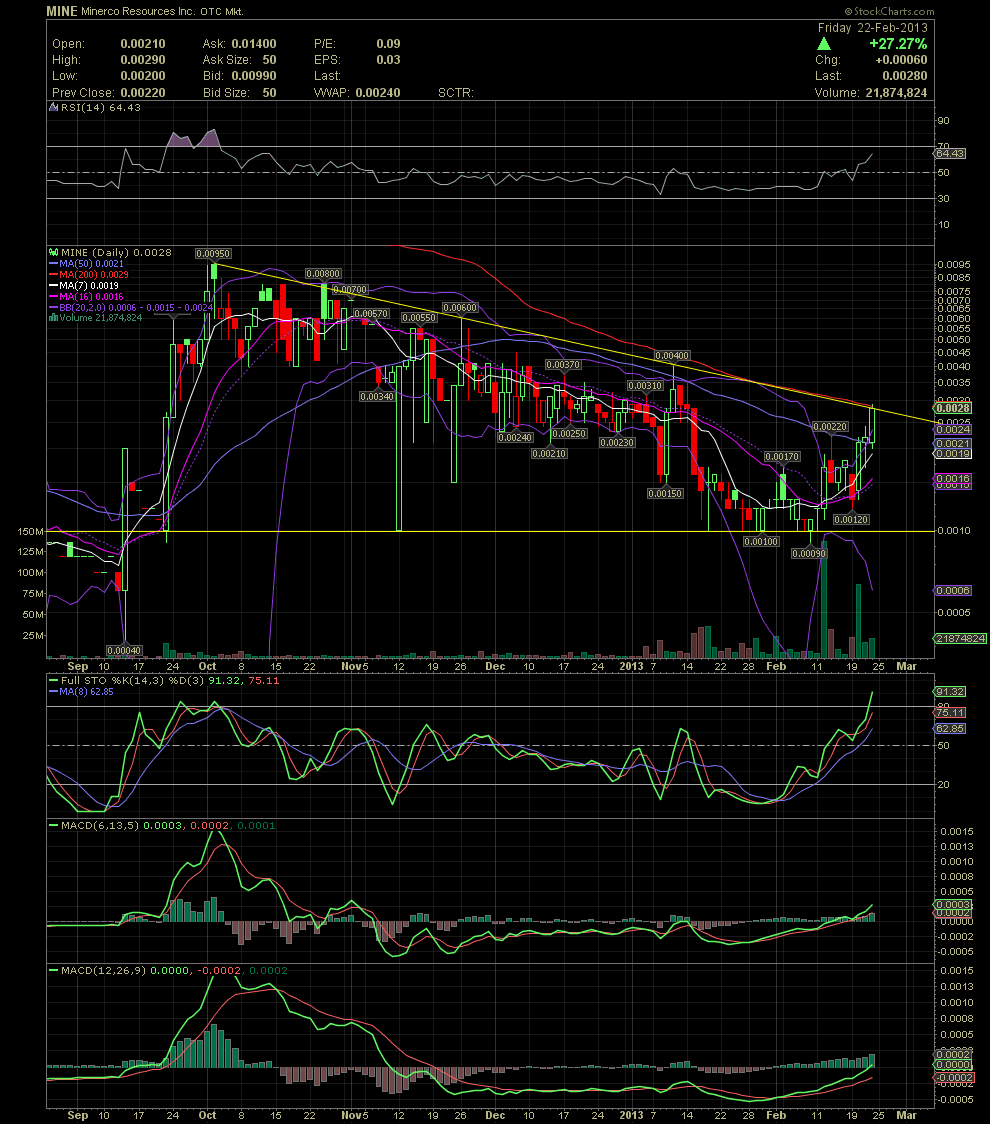
Link back to my MINE notes and chart of Feb 21 at: http://investorshangout.com/board/69062/Big-Tunas-Stocks. I mentioned a close of .002 would bring into play a possible quick test of the MA200 which was sitting at .0029. Friday's intraday high was .0029. With the stock closing at .0028, it's my opinion that the coming week could take us to the horizontal resistance of .004. The long term declining tops line is also crossing at the same level of the MA200. Both MACDs have both crossed over its zero line and the separation of the signal and indicator lines is beginning to widen, which is a very good thing. The FullSto is already in slightly overbought territory, but since that's a fast momentum indicator, it only pertains to the very short term. The RSI is still under its 70 line with more room to go. We already see the MA7 having crossed over the MA16 and 20. A move of the MA7 and 10 over the MA50 will seen this coming week. A move of the MA16 and 20 over the MA50 could be seen over the next 2-3 weeks should the stock price stay reasonable firm. Should the stock price move over the declining tops line, I believe MINE will be testing the .004 by the end of the week. Again, for those that accumulated shares in the .001 to .0015 range with us, it's beginning to pay off. GLTA

 (0)
(0) (0)
(0)