Introduction to Aben Resources ...................
Post# of 1088
(Total Views: 700)
Posted On: 07/21/2021 5:42:15 PM

Introduction to Aben Resources ..................................................................
Aben Resources Ltd. is a publicly traded Canadian GOLD exploration company with significant projects in BRITISH COLUMBIA and the YUKON TERRITORY.
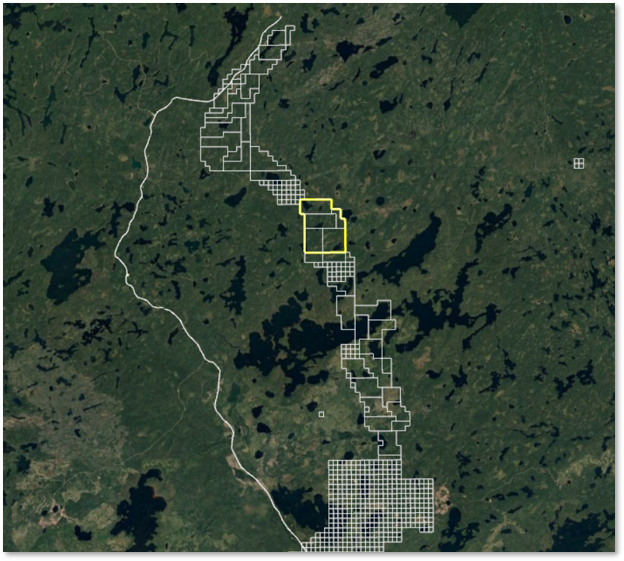
The Company's 100% owned flagship 23,000 hectares FORREST KERR GOLD PROJECT is located in the heart of a region called the GOLDEN TRIANGLE in northwestern British Columbia. This region has hosted significant mineral deposits including: Pretium (Brucejack), Eskay Creek, Snip, Galore Creek, Copper Canyon, Schaft Creek, KSM, Granduc, Red Chris and more.
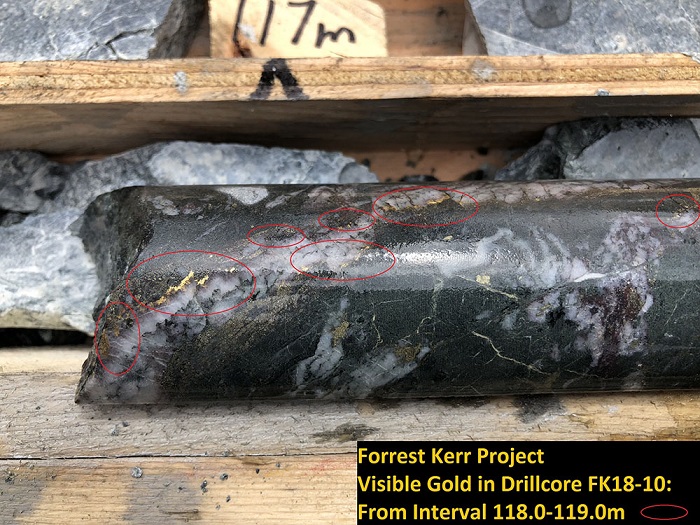
The first drill hole of 2018 at the Forrest Kerr Project discovered multiple high-grade zones including 62.4 g/t Gold over 6.0 meters within 38.7 g/t Gold over 10.0 meters starting at 114 meters downhole at the North Boundary Zone.
Aben also holds a 100% interest in the 7,411 hectares JUSTIN GOLD PROJECT located in the southeast Yukon. The Justin property is located on the Tintina Gold Belt to the immediate southeast of Golden Predator's 3 Aces gold project. Previous drilling by Aben intercepted 60 meters of 1.19 g/t Gold including 21 meters of 2.47 g/t Gold in the POW Zone. The geochemical signature of the mineralized zone is characterized by elevated Au, Bi, Cu, Mo and W supporting an Intrusion Related Gold System (IRGS).
Recent exploration at the Justin Project discovered the Lost Ace Zone located within 2 km of the POW Zone and bears striking similarities to Golden Predators adjacent 3 Aces project. 2018 trenching at the Lost Ace Zone returned values ranging from trace to 20.8 g/t Gold over 4.4 meters including 88.2 g/t Gold over 1.0 meter. Lost Ace is interpreted to be orogenic-style quartz-gold veins pointing towards the existence of a multi-phase hydrothermal system with the potential for overprinting mineralizing with the POW Zone.
===============
Stock Information
===============
Share Outstanding: 128 million
Ticker Symbols:
TSX Venture, Canada: ABN.V
United States of America: OTCQB Market: ABNAF
Frankfurt Exchange, Germany: E2L2
=========================
Stock charts and stock trading
=========================
ABN.V Daily chart 1yr
https://stockcharts.com/h-sc/ui?s=ABN.V&p...3377072265
ABN.V Weekly chart 3yr
https://stockcharts.com/h-sc/ui?s=ABN.V&p...3880278736
ABN.V Monthly chart 5yr
https://bigcharts.marketwatch.com/advchart/fr...p;state=10
ABN.V Last 10 trades, Bid, Ask, Volume
http://www.stockwatch.com/Quote/Detail.aspx?s...p;region=C
~~~~~~~~~~~~~~~~~~~~~~~~~~~~~~~~~~~~~~~
ABNAF Daily chart 1yr
https://stockcharts.com/h-sc/ui?s=ABNAF&p...8136657349
ABNAF Weekly chart 3yr
https://stockcharts.com/h-sc/ui?s=ABNAF&p...3797599655
ABNAF Monthly chart 5yr
https://bigcharts.marketwatch.com/advchart/fr...e=2&ti
ABNAF Last 10 trades
http://www.stockwatch.com/Quote/Detail.aspx?U:ABNAF
ABNAF Bids, Asks, Volume
https://www.otcmarkets.com/stock/ABNAF/quote
~~~~~~~~~~~~~~~~~~~~~~~~~~~~~~~~~~~~~~~
Germany Frankfurt: E2L2 Monthly chart 5yr
https://bigcharts.marketwatch.com/advchart/fr...p;state=10
===============================
Outstanding Shares, Warrants, Options
===============================
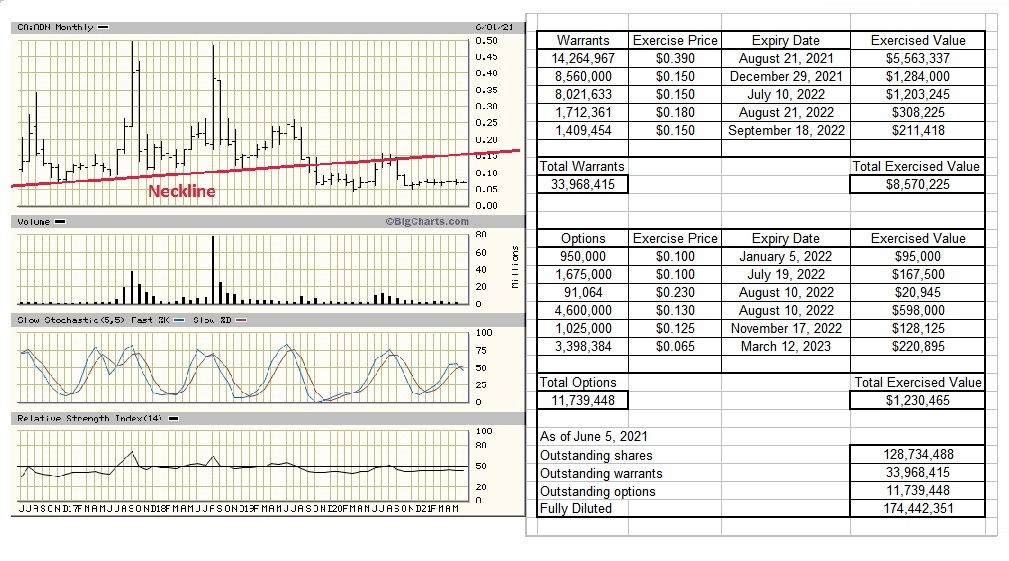
Click for enlarge view
https://investorshangout.com/images/MYImages/...ptions.jpg
=======================================
Financial filing and official company news release
=======================================
https://sedar.com/DisplayCompanyDocuments.do?...o=00005652
====================================
Company website and Corporate Presentation
====================================
https://www.abenresources.com/
https://www.abenresources.com/site/assets/fil...y_2021.pdf
========================================================
Video presentation - Golden Triangle and Forrest Kerr mining property
========================================================
Introduction to The Golden Triangle of British Columbia
https://www.youtube.com/watch?v=rBY6t3FHu7I
Overview of Aben's Forrest Kerr property
https://www.youtube.com/watch?v=egG5OWpTq0s
Aben Resources - gold contents in drill cores
https://www.youtube.com/watch?v=rUuDeaYt5ew
Gold resources in Aben's neighbors
https://www.youtube.com/watch?v=eQpWgPJKln0
=========================
Mining properties Information
=========================
Justin Property, Yukon
https://www.abenresources.com/projects/justin/
Flagship Forrest Kerr property in the Golden Triangle of British Columbia
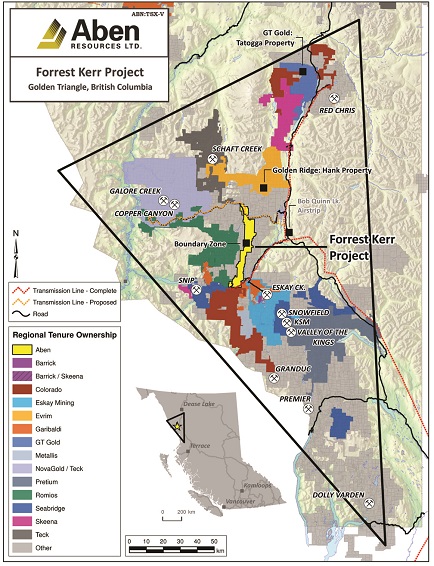
Forrest Kerr property covers 23,397 hectares or 234 square Km (6.1 Km x 38.3 Km)
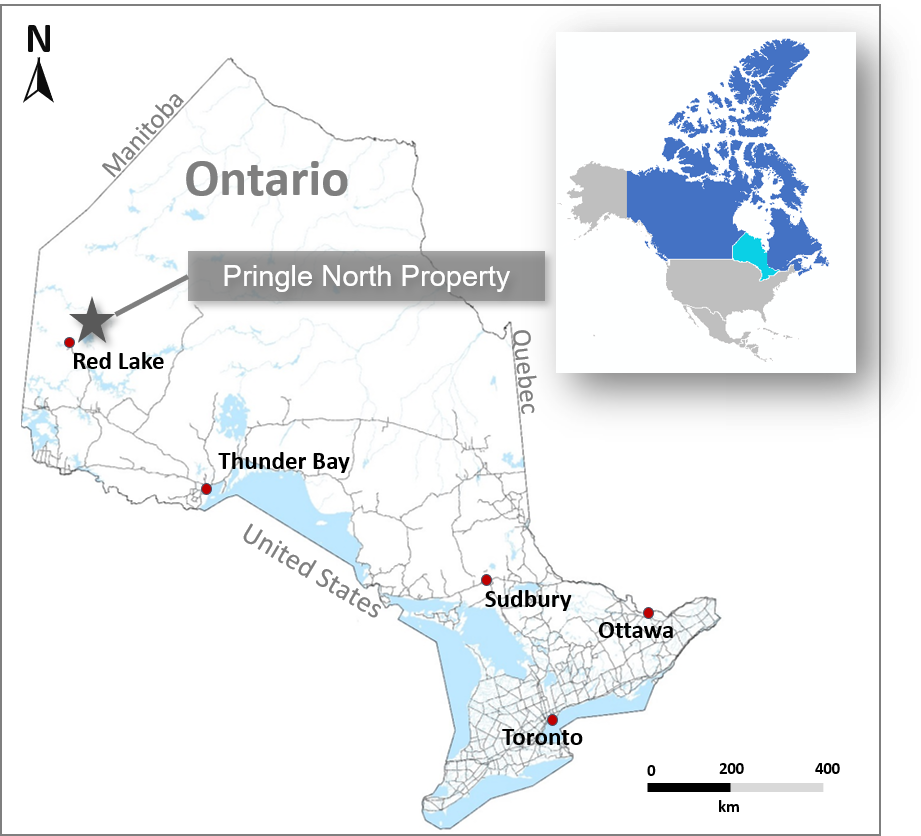
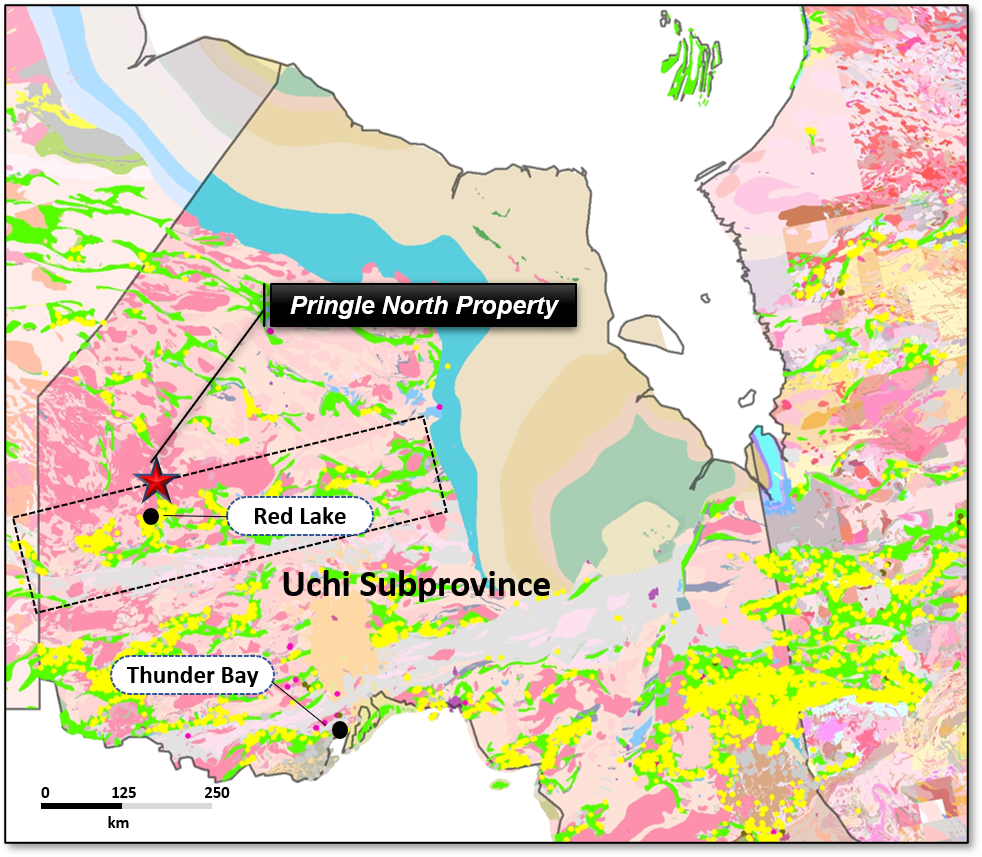
Pringle North property in Red Lake, Ontario
Aben Resources Executes Agreement on Red Lake Area Gold Project to acquire 1881 hectare (4.33 Km x 4.33 Km = 18.8 square Km) of gold property in Pringle North
==========================
Track record of past explorations
==========================
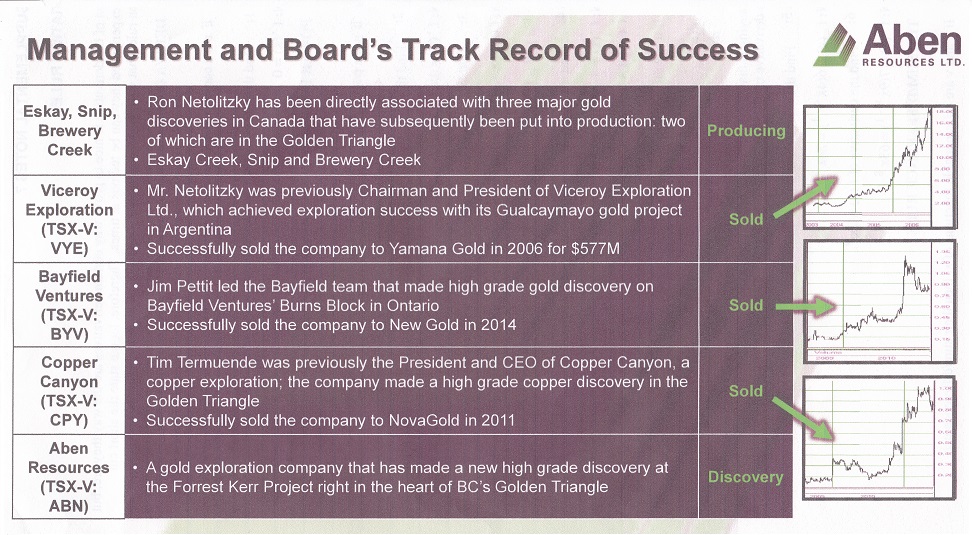
5 gold/copper mines (Eskay Creek mine, Snip mine, Burns Block mine and Copper Canyon mine in the Golden Triangle, Gualcamay mine in Argentina) were discovered by the 3 experienced, subtle and strategic geologists affiliated with Aben Resources with the corresponding companies sold to other mining companies.
Click for enlarged view
https://investorshangout.com/images/MYImages/...essold.jpg
CEO James Pettit sold Bayfield Ventures to New Gold Inc.
https://m.marketscreener.com/quote/stock/BAYF...-19365314/
Geologists:
Ron Netolitzky
https://www.mininghalloffame.ca/ronald-k-netolitzky
Tim J. Termuende, P. Geo, President & CEO of Eagle Plains Resources
Tim is a professional geologist with over 35 years’ experience in the mineral exploration industry. Since leaving Cominco in the late 1980’s, Tim has worked on exploration projects throughout North and South America and currently oversees a broad range of projects targeting various commodities throughout British Columbia, Saskatchewan, Yukon and Northwest Territories. He has been involved with numerous publicly-traded corporations since 1994, including Copper Canyon Resources Ltd., which was acquired by NovaGold in 2011 for approximately $65M.
https://www.eagleplains.com/sites/default/fil...k=t2-IWDGx
NovaGold acquired Copper Canyon Resources in the Golden Triangle at $1.05 per share
https://www.northernminer.com/news/copper-can...000404723/
Cornell McDowell P. Geo, V.P. of Exploration
Interview with Aben VP Exploration Cornell McDowell at Forrest Kerr, Golden Triangle, BC, Gold Project
https://www.facebook.com/abenresources/videos...392516340/
=================================================
Other buyout deals in the Golden Triangle of British Columbia
=================================================
Placer Dome and International Corona acquired Stikine Resources at $67 per share
https://www.rockridgeresourcesltd.com/news-an...tent_id=60
Imperial Metals acquired American Bullion Minerals at $2.45 a share
https://www.imperialmetals.com/for-our-shareh...an-bullion
Newmont acquired GT Gold at $3.25 per share
https://www.gtgoldcorp.ca/_resources/news/nr_2021_03_10.pdf
=============================================
Media commentary and interview with CEO James Pettit
=============================================
Equity.Guru video: Aben Resources' (ABN.V) golden triangle opportunity explained by Fabiana Lara
https://www.youtube.com/watch?v=-Mj2R4jvb0A
2018 - Silver and Gold Summit - High grade gold and copper discovery in Forrest Kerr
https://cambridgehouse.com/video/8213/highgra...ources-ltd
2019 - Massive gold nuggets found in outcrop of Aben's Justin property in Yukon
https://www.youtube.com/watch?v=13goOuptl_w
2020 - CEO James Pettit's update on the company's exploration and drilling in Forrest Kerr
https://www.facebook.com/abenresources/videos...326774690/
=============
Media Coverage
=============
The Resource Maven on Aben Resources
http://www.321gold.com/editorials/preston/preston111418.html
https://miningfeeds.com/2018/11/07/aben-resou...le-winner/
https://investingnews.com/company-profiles/ab...-triangle/
http://energyandgold.com/2018/05/08/aben-reso...-triangle/
https://www.investorideas.com/news/2019/main/...ources.asp
=============================
Aben Resources in the social media
=============================
LinkedIn
https://ca.linkedin.com/company/aben-resources-tsx-v-abn-
Twitter
https://twitter.com/Aben_ABN/
======================
Insider Trading Information
======================
Canadian Insider
https://www.canadianinsider.com/company?ticker=ABN
==================
Outlook for gold price
==================
https://youtu.be/d0ZBpZV4EIs
https://www.youtube.com/watch?v=l8RauDwklyY
====================================
Outlook for commodities prices and inflation
====================================
Continuous economic stimulus and weak US Dollar are needed amid weak economic growth. Strong bond prices reflects that interest rate will remain low. The US Dollar Index will likely decline to level 80 in the coming months followed by a side way consolidation. Gold and mining stocks will strive as the economy improves with rising inflation expectation.
Technically US Dollar Index has peaked out at 104, it is in a long term down trend towards level 80, commodities prices are rising as they are inversely related to the strength of U.S. Dollar
https://bigcharts.marketwatch.com/advchart/fr...&indic
Organization for Economic Co-operation and Development - Inflation forecast 2021 - 2022
https://data.oecd.org/price/inflation-forecast.htm
Goldman Sach - The outlook for commodities bull market in 2021
https://www.youtube.com/watch?v=y9yuyAAn5Dc
Potential supercycle bodes well for precious metals in 2021, says analyst
https://www.cnbc.com/video/2020/12/18/potenti...alyst.html
Economic boom in China will lead to another commodities supercycle similar to that between the year 2000 to 2008.
https://www.theguardian.com/business/2021/jan...supercycle
Here's Why Commodities are Worth Investing in Right Now
https://www.nasdaq.com/articles/heres-why-com...2021-01-19
Scotiabank’s Marc Desormeaux looks at 2021 and the continuing impact of Covid-19 on metals markets
https://www.northernminer.com/commodities-mar...003825843/
=============
Global Inflation
=============
US annual inflation
https://tradingeconomics.com/united-states/inflation-cpi
Canada annual inflation
https://tradingeconomics.com/canada/inflation-cpi
China annual inflation
https://tradingeconomics.com/china/inflation-cpi
Germany annual inflation
https://tradingeconomics.com/germany/inflation-cpi
France annual inflation
https://tradingeconomics.com/france/inflation-cpi
UK annual inflation
https://tradingeconomics.com/united-kingdom/inflation-cpi
Brazil annual inflation
https://tradingeconomics.com/brazil/inflation-cpi
Russia annual inflation
https://tradingeconomics.com/russia/inflation-cpi
India annual inflation
https://tradingeconomics.com/india/inflation-cpi
South Africa annual inflation
https://tradingeconomics.com/south-africa/inflation-cpi
==============
M1 money supply
==============
US (currently at 18.6 trillion US Dollar)
https://d3fy651gv2fhd3.cloudfront.net/charts/...1=19210323
https://tradingeconomics.com/united-states/money-supply-m1
CANADA (currently at 1.4 trillion Canadian Dollar)
https://d3fy651gv2fhd3.cloudfront.net/charts/...1=19210323
CHINA (currently at 60 trillion Yuan)
https://d3fy651gv2fhd3.cloudfront.net/charts/...1=19210323
Germany (currently at 2.6 trillion Euro)
https://d3fy651gv2fhd3.cloudfront.net/charts/...1=19210323
France (currently at 1.7 trillion Euro)
https://d3fy651gv2fhd3.cloudfront.net/charts/...1=19210323
UK (currently at 2.1 trillion Pound Sterling - GBP)
https://d3fy651gv2fhd3.cloudfront.net/charts/...1=19210323
BRAZIL (currently at 580 billion Brazilian Real - BRL)
https://d3fy651gv2fhd3.cloudfront.net/charts/...1=19210323
Russia (currently at 31 trillion Russian Ruble - RUB)
https://d3fy651gv2fhd3.cloudfront.net/charts/...1=19210323
INDIA (currently at 43 trillion Indian Rupee - INR)
https://d3fy651gv2fhd3.cloudfront.net/charts/...1=19210323
South Africa (currently at 2.1 trillion South Africa Rand - ZAR)
https://d3fy651gv2fhd3.cloudfront.net/charts/...1=19210323
===============
Commodity Prices
===============
Lumber price
https://mrci.com/pdf/lb.pdf
Soybean
https://mrci.com/pdf/s.pdf
Soybean Oil
https://www.mrci.com/pdf/bo.pdf
Soybean meal
https://www.mrci.com/pdf/sm.pdf
Corn
https://www.mrci.com/pdf/c.pdf
Oats
https://www.mrci.com/pdf/o.pdf
Canola
https://www.mrci.com/pdf/rs.pdf
Wheat
https://mrci.com/pdf/w.pdf
Sugar
https://mrci.com/pdf/sb.pdf
Coffee
https://mrci.com/pdf/kc.pdf
Lean Hogs
https://www.mrci.com/pdf/he.pdf
Crude oil
https://mrci.com/pdf/cl.pdf
Gasoline
https://www.mrci.com/pdf/rb.pdf
Palladium
https://www.mrci.com/pdf/pa.pdf
============================================
Price chart for Gold, Silver, Copper, XAU Mining Index
============================================
Gold Price
https://stockcharts.com/h-sc/ui?s=%24GOLD&...9325303251
https://mrci.com/pdf/gc.pdf
Silver Price
https://stockcharts.com/h-sc/ui?s=%24SILVER&a...5832796445
https://mrci.com/pdf/si.pdf
Copper Price
https://stockcharts.com/h-sc/ui?s=%24COPPER&a...7009666446
https://www.mrci.com/pdf/hg.pdf
XAU Mining Index
https://stockcharts.com/h-sc/ui?s=%24XAU&...0985509425
XAU mining stock Index monthly chart (The 15-year Head-And-Shoulder pattern formed between year 2000 and 2015 signals a prolonged up trend in mining stocks to possibly new record high)
https://bigcharts.marketwatch.com/advchart/fr...62&y=4
Global mining stock Index
https://stockcharts.com/h-sc/ui?s=%24SPTGM&am...5126536165
==========================================================
Mining companies operating in the Golden Triangle of British Columbia
==========================================================
Aben Resources is a new comer to the Golden Triangle while most of the explorers have been
operating there for decades, delineating their resources and reserves to enhance shareholder
value. CEO James Pettit optioned Forrest Kerr in 2016, in the subsequent 3 years he drilled
and incurred exploration expenses to meet the option agreement, completed the Earn-In in
November 2019 and now owns 100% of Forrest Kerr property.
Mining explorers operating in the prolific Golden Triangle of British Columbia
Share prices are not up to date, they are for comparison.
1 HAWK.V Hawkeye Gold and Diamond $0.030 https://stockcharts.com/h-sc/ui?s=HAWK.V&...7176714740
2 RG.V Romios Gold Resources $0.045 https://stockcharts.com/h-sc/ui?s=RG.V&p=...3258189645
3 DEC.V Decade Resources $0.050 https://stockcharts.com/h-sc/ui?s=DEC.V&p...1633995508
4 ABN.V Aben Resources $0.070 https://stockcharts.com/h-sc/ui?s=ABN.V&p...7496113214
5 MRO.V Millrock Resources $0.090 https://stockcharts.com/h-sc/ui?s=MRO.V&p...6836544963
6 SKYG.V Sky Gold Corp $0.170 https://stockcharts.com/h-sc/ui?s=SKYG.V&...4081325604
7 REL.V Roughrider Exploration $0.140 https://stockcharts.com/h-sc/ui?s=REL.V&p...4842327726
8 ENDR.V Enduro Metals Corporation $0.210 https://stockcharts.com/h-sc/ui?s=ENDR.V&...0889726269
9 SCOT.V Scottie Resources $0.230 https://stockcharts.com/h-sc/ui?s=SCOT.V&...5282581933
10 MTB.V Mountain Boy Minerals $0.180 https://stockcharts.com/h-sc/ui?s=MTB.V&p...5090334703
11 BBB.V Brixton Metals Corporation $0.200 https://stockcharts.com/h-sc/ui?s=BBB.V&p...4146375562
12 AMK.V American Creek Resources $0.250 https://stockcharts.com/h-sc/ui?s=AMK.V&p...4902895968
13 EVER.V Evergold Corp $0.330 https://stockcharts.com/h-sc/ui?s=EVER.V&...9306455150
14 GGI.V Garibaldi Resources Corp $0.440 https://stockcharts.com/h-sc/ui?s=GGI.V&p...6339012581
15 SASY.CA Sassy Resources $0.630 https://stockcharts.com/h-sc/ui?s=SASY.CA&...7712944421
16 MTS.V Metallis Resources $0.510 https://stockcharts.com/h-sc/ui?s=MTS.V&p...3708570676
17 DV.V Dolly Varden Silver Corp $0.640 https://stockcharts.com/h-sc/ui?s=DV.V&p=...0211663558
18 AOT.TO Ascot Resources $1.170 https://stockcharts.com/h-sc/ui?s=AOT.TO&...1773813526
19 QEX.V QuestEx Gold & Copper $1.030 https://stockcharts.com/h-sc/ui?s=QEX.V&p...7398162842
20 BNCH.V Benchmark Metals $1.580 https://stockcharts.com/h-sc/ui?s=BNCH.V&...8185217032
21 ESK.V Eskay Mining Corp $2.110 https://stockcharts.com/h-sc/ui?s=ESK.V&p...2221768177
22 TUO.V Teuton Resources Corp $2.370 https://stockcharts.com/h-sc/ui?s=TUO.V&p...1926720407
23 TUD.V Tudor Gold Corp $2.710 https://stockcharts.com/h-sc/ui?s=TUD.V&p...7186783346
24 SKE.TO Skeena Resources $3.190 https://stockcharts.com/h-sc/ui?s=SKE.TO&...2377942100
25 III.TO Imperial Metals Corp $5.250 https://stockcharts.com/h-sc/ui?s=III.TO&...2125642263
26 PVG.TO Pretium Resources $13.190 https://stockcharts.com/h-sc/ui?s=PVG.TO&...0112557228
27 ELD.TO Eldorado Gold Corp $13.150 https://stockcharts.com/h-sc/ui?s=ELD.TO&...0529029750
28 SEA.TO Seabridge Gold $21.220 https://stockcharts.com/h-sc/ui?s=SEA.TO&...9592454206
Due to lack of basic infrastructure like power line and accessible roads, exploration and discoveries have been arduous in the Golden Triangle in the past decades, it took Seabridge Gold 41 years to achieve its current mineral reserves and resources since its formation in 1979. https://www.seabridgegold.com/company/overview
Thanks to Brian Kynoch, P.Eng. and President of Imperial Metals, his desire to construct a copper mine at Red Chris prompted the government to construct highway and roads and install power line through the Golden Triangle since 2012, with the basic infrastructure in place and with the progress in modern day mineral detection technology, potential rapid discovery of bonanza gold deposits in the Forrest Kerr fault zone and accurate resources estimate through 3-D imaging can be achieved.
==============================================
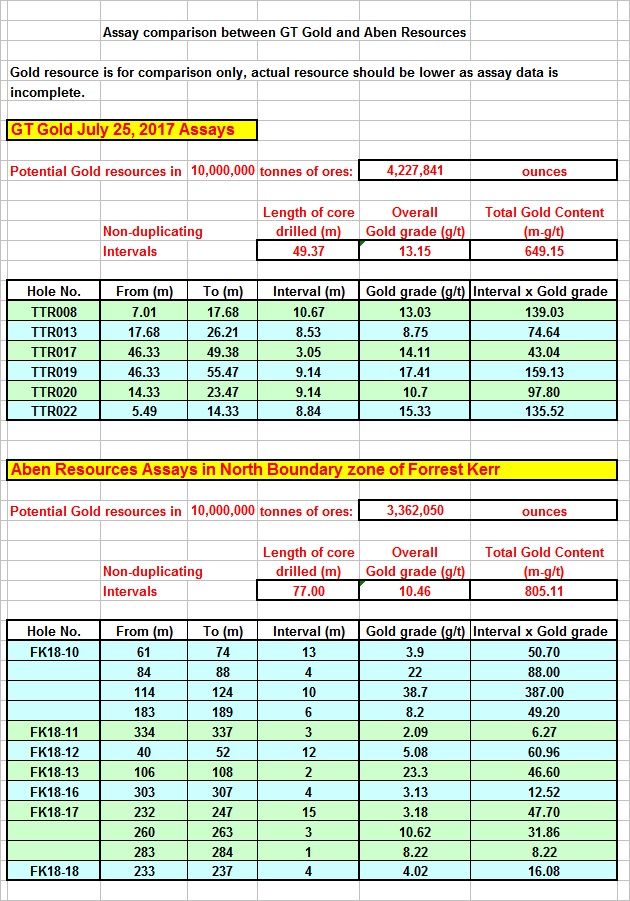
Aben Resources's drill assay and potential gold resource
==============================================
Being a close neighbor to Eskay Creek mine with similar geology, Forrest Kerr can potentially has similar gold deposits.
History of Eskay Creek mine, the world's massive high grade gold mine
In 1932 a prospector named Tom Mackay of Consolidated Stikine Resources was the first to recognize the area's unique geological setting after spotting an alluring rock outcrop from his single-engine bush plane. After staking the property he discovered a boulder broken free from its source higher up on the mountain, rolling several dozen meters downslope, assays from the boulder returned a spectacular five ounces of gold per tonne. Mackay explored the property for over 50 years but bonanza gold deposit was never found. In 1988 after investing in Consolidated Stikine Resources which held rights to Eskay Creek, geologist Ron Netolitzky became Stikine’s technical person and one of five controlling shareholders. He teamed up with Murray Pezim of Calpine Resources to raise $900,000 for a drill program and started exploring the area in the summer of 1990. After drilling 108 holes and with momentum building, they hit a fault. Chet Idziszek, Pezim’s geologist with a M.Sc. degree from McGill University observed gradually increasing gold grade and increasing interval length in the assays, he had an intuition that he must be very close to the main gold vein, he studied the maps and analysed the terrain then he ragged the drill rig to a spot 350 meters from the last hole drilled and drilled hole #109. Bingo, assays from hole 109 returned spectacular 27.2 g/t gold, 30.2 g/t silver over 208 meters (682 feet). In 1994 Eskay Creek went into production that lasted 14 years, finally ended in 2008. Eskay Creek had the highest grade gold on the planet and produced 3.3 million ounces of gold at a breathtaking 45 g/t Au, also 160 million ounces of silver at 2,224 g/t. Stikine Resources was acquired by Placer Dome and International Corona for $67 per share. Ron Netolitzky has had a very successful career in mining and mineral exploration with decades of experience and having been directly associated with three major mineral discoveries in Canada that have subsequently been put into production: Eskay Creek, Snip and Brewery Creek. Ron Netolitzky was inducted into the Canadian Mining Hall of Fame in 2014.
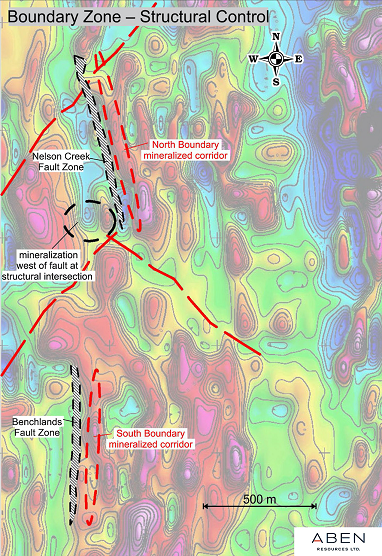
Map of Forrest Kerr and the Boundary Zone.
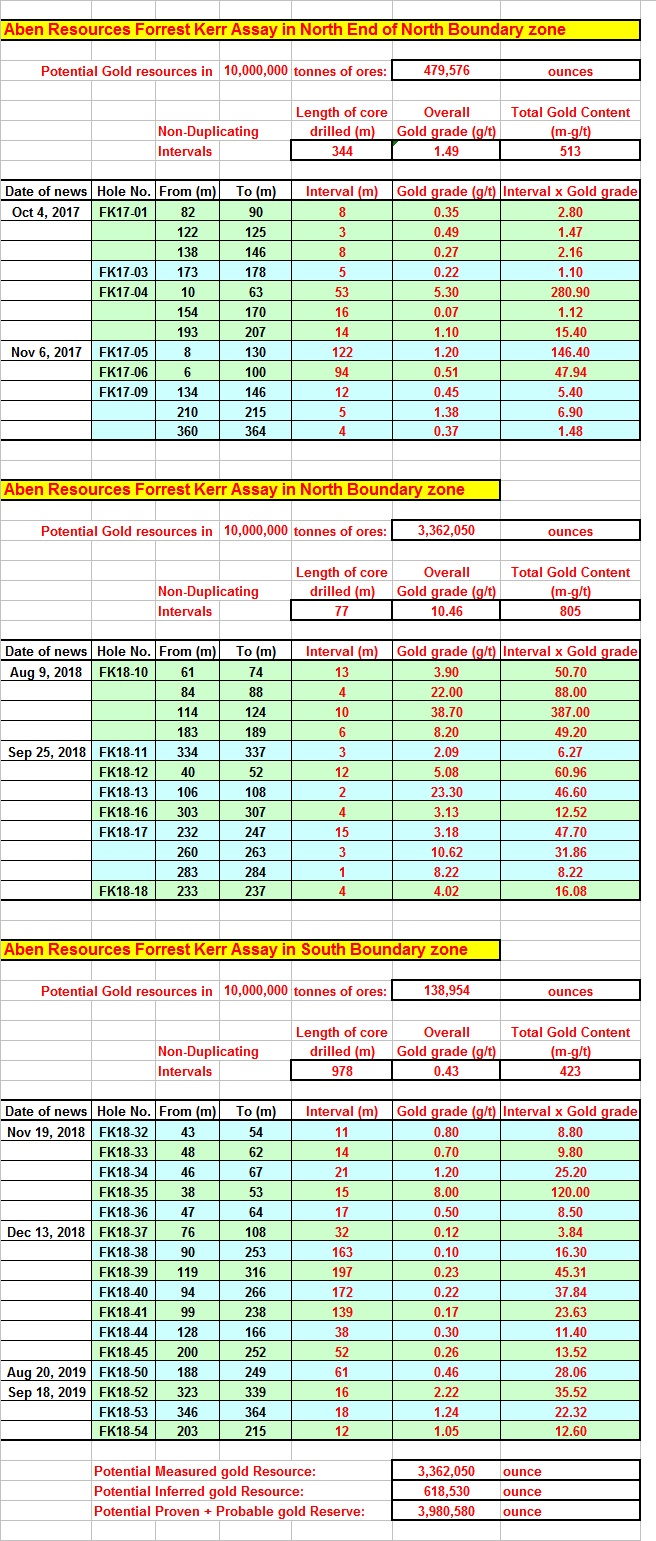
Aben Resources's assay and potential gold resource
https://investorshangout.com/images/MYImages/...nAssay.jpg
Newmont acquired GT Gold at $3.25 per share
https://www.gtgoldcorp.ca/_resources/news/nr_2021_03_10.pdf
Historical share price of GT Gold ( It could be Aben Resources's "Vision For The Future" ! )
https://investorshangout.com/images/MYImages/...ychart.gif
Assay comparison between GT Gold and Aben Resources
===============
Chart Technicality
===============
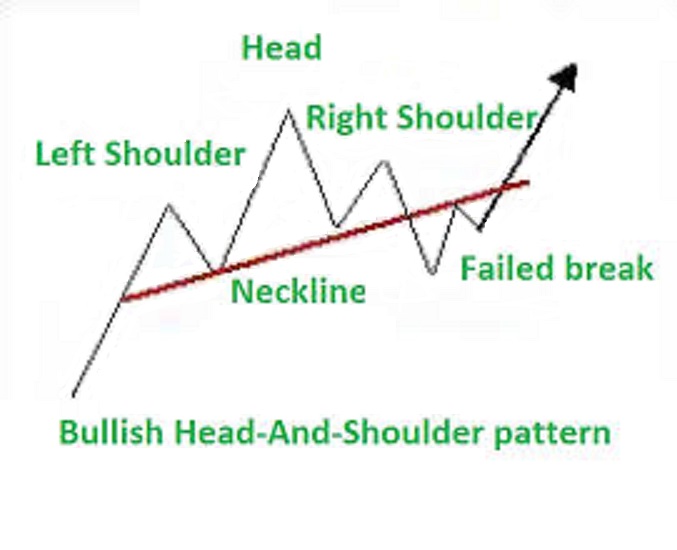
Chart is not only a historical record, quite often it can predict the future, it is an important trading tool, no investor can be successful without referring to charts. Trading without charts is like an airplane pilot flying without any navigation instrument but only by hunch and guessing, chances are he will end up in crash-and-burn. Head-And-Shoulder is a natural chart formation in Nature, it is the most reliable and predictable chart pattern among all chart formations.
Bullish Head-And-Shoulder pattern - fail break pattern
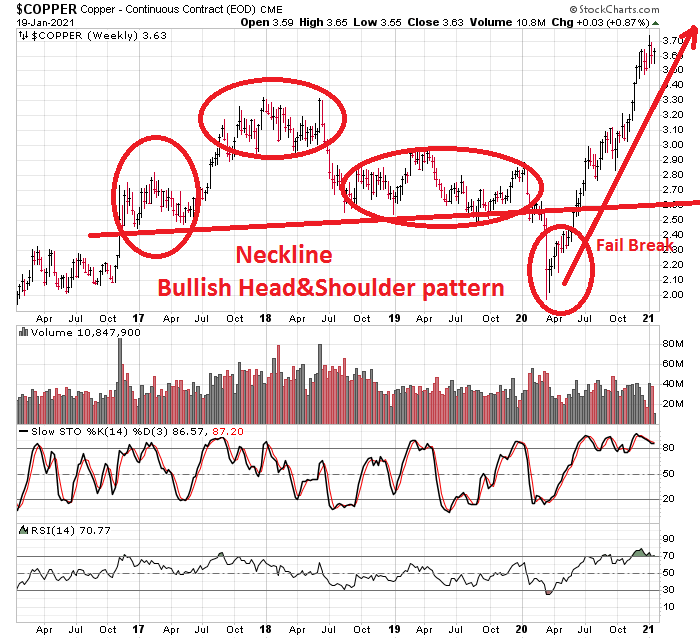
Bullish Head-And-Shoulder pattern in copper
Bullish Head-And-Shoulder pattern in XAU mining index
ABN.V share price future scenario

Click for enlarged view
https://investorshangout.com/images/MYImages/...04_ABN.jpg
===================================
Testament for the Golden Triangle potential
===================================
In the year 2000 I scanned several hundred long term weekly charts of mining stock companies in my search for one with promising future as I believe in charts. One chart with a bullish Head-And_Shoulder pattern immediately caught my special interest, from my diligent research, I found out that mining company had 6 billion pound of commercially viable copper resources in its Red Chris project in the Golden Triangle of British Columbia, so I bought 200,000 shares of American Bullion Minerals at 5 cents for long term investment. In the year 2011 the company was bought out by Imperial Metals at $2.40 a share, the sale offered me an early retirement. Recently I again scanned several hundred mining stock charts and again one chart stood out among others like a star shining brightly among dark matters of the Universe and has the potential of exploding into a supernova. Based on the spectacular assays in the Forrest Kerr, I have strong confidence that there are bonanza gold deposits somewhere in the property as the saying goes: When there is smoke, there is fire, similarly, the moderately long intervals of high grade gold, especially the phenomenon of visible gold is a promising sign that bonanza gold deposits may exist somewhere in Forrest Kerr, it is up to the geologists to trace them to the source: A gold vein with numerous gold arteries that can run for hundreds of meters.
Red Chris Mine (at the top right corner of the Golden Triangle)
https://investorshangout.com/images/MYImages/...ABNmap.jpg
Aben Resources Ltd. is a publicly traded Canadian GOLD exploration company with significant projects in BRITISH COLUMBIA and the YUKON TERRITORY.
The Company's 100% owned flagship 23,000 hectares FORREST KERR GOLD PROJECT is located in the heart of a region called the GOLDEN TRIANGLE in northwestern British Columbia. This region has hosted significant mineral deposits including: Pretium (Brucejack), Eskay Creek, Snip, Galore Creek, Copper Canyon, Schaft Creek, KSM, Granduc, Red Chris and more.
The first drill hole of 2018 at the Forrest Kerr Project discovered multiple high-grade zones including 62.4 g/t Gold over 6.0 meters within 38.7 g/t Gold over 10.0 meters starting at 114 meters downhole at the North Boundary Zone.
Aben also holds a 100% interest in the 7,411 hectares JUSTIN GOLD PROJECT located in the southeast Yukon. The Justin property is located on the Tintina Gold Belt to the immediate southeast of Golden Predator's 3 Aces gold project. Previous drilling by Aben intercepted 60 meters of 1.19 g/t Gold including 21 meters of 2.47 g/t Gold in the POW Zone. The geochemical signature of the mineralized zone is characterized by elevated Au, Bi, Cu, Mo and W supporting an Intrusion Related Gold System (IRGS).
Recent exploration at the Justin Project discovered the Lost Ace Zone located within 2 km of the POW Zone and bears striking similarities to Golden Predators adjacent 3 Aces project. 2018 trenching at the Lost Ace Zone returned values ranging from trace to 20.8 g/t Gold over 4.4 meters including 88.2 g/t Gold over 1.0 meter. Lost Ace is interpreted to be orogenic-style quartz-gold veins pointing towards the existence of a multi-phase hydrothermal system with the potential for overprinting mineralizing with the POW Zone.
===============
Stock Information
===============
Share Outstanding: 128 million
Ticker Symbols:
TSX Venture, Canada: ABN.V
United States of America: OTCQB Market: ABNAF
Frankfurt Exchange, Germany: E2L2
=========================
Stock charts and stock trading
=========================
ABN.V Daily chart 1yr
https://stockcharts.com/h-sc/ui?s=ABN.V&p...3377072265
ABN.V Weekly chart 3yr
https://stockcharts.com/h-sc/ui?s=ABN.V&p...3880278736
ABN.V Monthly chart 5yr
https://bigcharts.marketwatch.com/advchart/fr...p;state=10
ABN.V Last 10 trades, Bid, Ask, Volume
http://www.stockwatch.com/Quote/Detail.aspx?s...p;region=C
~~~~~~~~~~~~~~~~~~~~~~~~~~~~~~~~~~~~~~~
ABNAF Daily chart 1yr
https://stockcharts.com/h-sc/ui?s=ABNAF&p...8136657349
ABNAF Weekly chart 3yr
https://stockcharts.com/h-sc/ui?s=ABNAF&p...3797599655
ABNAF Monthly chart 5yr
https://bigcharts.marketwatch.com/advchart/fr...e=2&ti
ABNAF Last 10 trades
http://www.stockwatch.com/Quote/Detail.aspx?U:ABNAF
ABNAF Bids, Asks, Volume
https://www.otcmarkets.com/stock/ABNAF/quote
~~~~~~~~~~~~~~~~~~~~~~~~~~~~~~~~~~~~~~~
Germany Frankfurt: E2L2 Monthly chart 5yr
https://bigcharts.marketwatch.com/advchart/fr...p;state=10
===============================
Outstanding Shares, Warrants, Options
===============================
Click for enlarge view
https://investorshangout.com/images/MYImages/...ptions.jpg
=======================================
Financial filing and official company news release
=======================================
https://sedar.com/DisplayCompanyDocuments.do?...o=00005652
====================================
Company website and Corporate Presentation
====================================
https://www.abenresources.com/
https://www.abenresources.com/site/assets/fil...y_2021.pdf
========================================================
Video presentation - Golden Triangle and Forrest Kerr mining property
========================================================
Introduction to The Golden Triangle of British Columbia
https://www.youtube.com/watch?v=rBY6t3FHu7I
Overview of Aben's Forrest Kerr property
https://www.youtube.com/watch?v=egG5OWpTq0s
Aben Resources - gold contents in drill cores
https://www.youtube.com/watch?v=rUuDeaYt5ew
Gold resources in Aben's neighbors
https://www.youtube.com/watch?v=eQpWgPJKln0
=========================
Mining properties Information
=========================
Justin Property, Yukon
https://www.abenresources.com/projects/justin/
Flagship Forrest Kerr property in the Golden Triangle of British Columbia
Forrest Kerr property covers 23,397 hectares or 234 square Km (6.1 Km x 38.3 Km)
Pringle North property in Red Lake, Ontario
Aben Resources Executes Agreement on Red Lake Area Gold Project to acquire 1881 hectare (4.33 Km x 4.33 Km = 18.8 square Km) of gold property in Pringle North
==========================
Track record of past explorations
==========================
5 gold/copper mines (Eskay Creek mine, Snip mine, Burns Block mine and Copper Canyon mine in the Golden Triangle, Gualcamay mine in Argentina) were discovered by the 3 experienced, subtle and strategic geologists affiliated with Aben Resources with the corresponding companies sold to other mining companies.
Click for enlarged view
https://investorshangout.com/images/MYImages/...essold.jpg
CEO James Pettit sold Bayfield Ventures to New Gold Inc.
https://m.marketscreener.com/quote/stock/BAYF...-19365314/
Geologists:
Ron Netolitzky
https://www.mininghalloffame.ca/ronald-k-netolitzky
Tim J. Termuende, P. Geo, President & CEO of Eagle Plains Resources
Tim is a professional geologist with over 35 years’ experience in the mineral exploration industry. Since leaving Cominco in the late 1980’s, Tim has worked on exploration projects throughout North and South America and currently oversees a broad range of projects targeting various commodities throughout British Columbia, Saskatchewan, Yukon and Northwest Territories. He has been involved with numerous publicly-traded corporations since 1994, including Copper Canyon Resources Ltd., which was acquired by NovaGold in 2011 for approximately $65M.
https://www.eagleplains.com/sites/default/fil...k=t2-IWDGx
NovaGold acquired Copper Canyon Resources in the Golden Triangle at $1.05 per share
https://www.northernminer.com/news/copper-can...000404723/
Cornell McDowell P. Geo, V.P. of Exploration
Interview with Aben VP Exploration Cornell McDowell at Forrest Kerr, Golden Triangle, BC, Gold Project
https://www.facebook.com/abenresources/videos...392516340/
=================================================
Other buyout deals in the Golden Triangle of British Columbia
=================================================
Placer Dome and International Corona acquired Stikine Resources at $67 per share
https://www.rockridgeresourcesltd.com/news-an...tent_id=60
Imperial Metals acquired American Bullion Minerals at $2.45 a share
https://www.imperialmetals.com/for-our-shareh...an-bullion
Newmont acquired GT Gold at $3.25 per share
https://www.gtgoldcorp.ca/_resources/news/nr_2021_03_10.pdf
=============================================
Media commentary and interview with CEO James Pettit
=============================================
Equity.Guru video: Aben Resources' (ABN.V) golden triangle opportunity explained by Fabiana Lara
https://www.youtube.com/watch?v=-Mj2R4jvb0A
2018 - Silver and Gold Summit - High grade gold and copper discovery in Forrest Kerr
https://cambridgehouse.com/video/8213/highgra...ources-ltd
2019 - Massive gold nuggets found in outcrop of Aben's Justin property in Yukon
https://www.youtube.com/watch?v=13goOuptl_w
2020 - CEO James Pettit's update on the company's exploration and drilling in Forrest Kerr
https://www.facebook.com/abenresources/videos...326774690/
=============
Media Coverage
=============
The Resource Maven on Aben Resources
http://www.321gold.com/editorials/preston/preston111418.html
https://miningfeeds.com/2018/11/07/aben-resou...le-winner/
https://investingnews.com/company-profiles/ab...-triangle/
http://energyandgold.com/2018/05/08/aben-reso...-triangle/
https://www.investorideas.com/news/2019/main/...ources.asp
=============================
Aben Resources in the social media
=============================
https://ca.linkedin.com/company/aben-resources-tsx-v-abn-
https://twitter.com/Aben_ABN/
======================
Insider Trading Information
======================
Canadian Insider
https://www.canadianinsider.com/company?ticker=ABN
==================
Outlook for gold price
==================
https://youtu.be/d0ZBpZV4EIs
https://www.youtube.com/watch?v=l8RauDwklyY
====================================
Outlook for commodities prices and inflation
====================================
Continuous economic stimulus and weak US Dollar are needed amid weak economic growth. Strong bond prices reflects that interest rate will remain low. The US Dollar Index will likely decline to level 80 in the coming months followed by a side way consolidation. Gold and mining stocks will strive as the economy improves with rising inflation expectation.
Technically US Dollar Index has peaked out at 104, it is in a long term down trend towards level 80, commodities prices are rising as they are inversely related to the strength of U.S. Dollar
https://bigcharts.marketwatch.com/advchart/fr...&indic
Organization for Economic Co-operation and Development - Inflation forecast 2021 - 2022
https://data.oecd.org/price/inflation-forecast.htm
Goldman Sach - The outlook for commodities bull market in 2021
https://www.youtube.com/watch?v=y9yuyAAn5Dc
Potential supercycle bodes well for precious metals in 2021, says analyst
https://www.cnbc.com/video/2020/12/18/potenti...alyst.html
Economic boom in China will lead to another commodities supercycle similar to that between the year 2000 to 2008.
https://www.theguardian.com/business/2021/jan...supercycle
Here's Why Commodities are Worth Investing in Right Now
https://www.nasdaq.com/articles/heres-why-com...2021-01-19
Scotiabank’s Marc Desormeaux looks at 2021 and the continuing impact of Covid-19 on metals markets
https://www.northernminer.com/commodities-mar...003825843/
=============
Global Inflation
=============
US annual inflation
https://tradingeconomics.com/united-states/inflation-cpi
Canada annual inflation
https://tradingeconomics.com/canada/inflation-cpi
China annual inflation
https://tradingeconomics.com/china/inflation-cpi
Germany annual inflation
https://tradingeconomics.com/germany/inflation-cpi
France annual inflation
https://tradingeconomics.com/france/inflation-cpi
UK annual inflation
https://tradingeconomics.com/united-kingdom/inflation-cpi
Brazil annual inflation
https://tradingeconomics.com/brazil/inflation-cpi
Russia annual inflation
https://tradingeconomics.com/russia/inflation-cpi
India annual inflation
https://tradingeconomics.com/india/inflation-cpi
South Africa annual inflation
https://tradingeconomics.com/south-africa/inflation-cpi
==============
M1 money supply
==============
US (currently at 18.6 trillion US Dollar)
https://d3fy651gv2fhd3.cloudfront.net/charts/...1=19210323
https://tradingeconomics.com/united-states/money-supply-m1
CANADA (currently at 1.4 trillion Canadian Dollar)
https://d3fy651gv2fhd3.cloudfront.net/charts/...1=19210323
CHINA (currently at 60 trillion Yuan)
https://d3fy651gv2fhd3.cloudfront.net/charts/...1=19210323
Germany (currently at 2.6 trillion Euro)
https://d3fy651gv2fhd3.cloudfront.net/charts/...1=19210323
France (currently at 1.7 trillion Euro)
https://d3fy651gv2fhd3.cloudfront.net/charts/...1=19210323
UK (currently at 2.1 trillion Pound Sterling - GBP)
https://d3fy651gv2fhd3.cloudfront.net/charts/...1=19210323
BRAZIL (currently at 580 billion Brazilian Real - BRL)
https://d3fy651gv2fhd3.cloudfront.net/charts/...1=19210323
Russia (currently at 31 trillion Russian Ruble - RUB)
https://d3fy651gv2fhd3.cloudfront.net/charts/...1=19210323
INDIA (currently at 43 trillion Indian Rupee - INR)
https://d3fy651gv2fhd3.cloudfront.net/charts/...1=19210323
South Africa (currently at 2.1 trillion South Africa Rand - ZAR)
https://d3fy651gv2fhd3.cloudfront.net/charts/...1=19210323
===============
Commodity Prices
===============
Lumber price
https://mrci.com/pdf/lb.pdf
Soybean
https://mrci.com/pdf/s.pdf
Soybean Oil
https://www.mrci.com/pdf/bo.pdf
Soybean meal
https://www.mrci.com/pdf/sm.pdf
Corn
https://www.mrci.com/pdf/c.pdf
Oats
https://www.mrci.com/pdf/o.pdf
Canola
https://www.mrci.com/pdf/rs.pdf
Wheat
https://mrci.com/pdf/w.pdf
Sugar
https://mrci.com/pdf/sb.pdf
Coffee
https://mrci.com/pdf/kc.pdf
Lean Hogs
https://www.mrci.com/pdf/he.pdf
Crude oil
https://mrci.com/pdf/cl.pdf
Gasoline
https://www.mrci.com/pdf/rb.pdf
Palladium
https://www.mrci.com/pdf/pa.pdf
============================================
Price chart for Gold, Silver, Copper, XAU Mining Index
============================================
Gold Price
https://stockcharts.com/h-sc/ui?s=%24GOLD&...9325303251
https://mrci.com/pdf/gc.pdf
Silver Price
https://stockcharts.com/h-sc/ui?s=%24SILVER&a...5832796445
https://mrci.com/pdf/si.pdf
Copper Price
https://stockcharts.com/h-sc/ui?s=%24COPPER&a...7009666446
https://www.mrci.com/pdf/hg.pdf
XAU Mining Index
https://stockcharts.com/h-sc/ui?s=%24XAU&...0985509425
XAU mining stock Index monthly chart (The 15-year Head-And-Shoulder pattern formed between year 2000 and 2015 signals a prolonged up trend in mining stocks to possibly new record high)
https://bigcharts.marketwatch.com/advchart/fr...62&y=4
Global mining stock Index
https://stockcharts.com/h-sc/ui?s=%24SPTGM&am...5126536165
==========================================================
Mining companies operating in the Golden Triangle of British Columbia
==========================================================
Aben Resources is a new comer to the Golden Triangle while most of the explorers have been
operating there for decades, delineating their resources and reserves to enhance shareholder
value. CEO James Pettit optioned Forrest Kerr in 2016, in the subsequent 3 years he drilled
and incurred exploration expenses to meet the option agreement, completed the Earn-In in
November 2019 and now owns 100% of Forrest Kerr property.
Mining explorers operating in the prolific Golden Triangle of British Columbia
Share prices are not up to date, they are for comparison.
1 HAWK.V Hawkeye Gold and Diamond $0.030 https://stockcharts.com/h-sc/ui?s=HAWK.V&...7176714740
2 RG.V Romios Gold Resources $0.045 https://stockcharts.com/h-sc/ui?s=RG.V&p=...3258189645
3 DEC.V Decade Resources $0.050 https://stockcharts.com/h-sc/ui?s=DEC.V&p...1633995508
4 ABN.V Aben Resources $0.070 https://stockcharts.com/h-sc/ui?s=ABN.V&p...7496113214
5 MRO.V Millrock Resources $0.090 https://stockcharts.com/h-sc/ui?s=MRO.V&p...6836544963
6 SKYG.V Sky Gold Corp $0.170 https://stockcharts.com/h-sc/ui?s=SKYG.V&...4081325604
7 REL.V Roughrider Exploration $0.140 https://stockcharts.com/h-sc/ui?s=REL.V&p...4842327726
8 ENDR.V Enduro Metals Corporation $0.210 https://stockcharts.com/h-sc/ui?s=ENDR.V&...0889726269
9 SCOT.V Scottie Resources $0.230 https://stockcharts.com/h-sc/ui?s=SCOT.V&...5282581933
10 MTB.V Mountain Boy Minerals $0.180 https://stockcharts.com/h-sc/ui?s=MTB.V&p...5090334703
11 BBB.V Brixton Metals Corporation $0.200 https://stockcharts.com/h-sc/ui?s=BBB.V&p...4146375562
12 AMK.V American Creek Resources $0.250 https://stockcharts.com/h-sc/ui?s=AMK.V&p...4902895968
13 EVER.V Evergold Corp $0.330 https://stockcharts.com/h-sc/ui?s=EVER.V&...9306455150
14 GGI.V Garibaldi Resources Corp $0.440 https://stockcharts.com/h-sc/ui?s=GGI.V&p...6339012581
15 SASY.CA Sassy Resources $0.630 https://stockcharts.com/h-sc/ui?s=SASY.CA&...7712944421
16 MTS.V Metallis Resources $0.510 https://stockcharts.com/h-sc/ui?s=MTS.V&p...3708570676
17 DV.V Dolly Varden Silver Corp $0.640 https://stockcharts.com/h-sc/ui?s=DV.V&p=...0211663558
18 AOT.TO Ascot Resources $1.170 https://stockcharts.com/h-sc/ui?s=AOT.TO&...1773813526
19 QEX.V QuestEx Gold & Copper $1.030 https://stockcharts.com/h-sc/ui?s=QEX.V&p...7398162842
20 BNCH.V Benchmark Metals $1.580 https://stockcharts.com/h-sc/ui?s=BNCH.V&...8185217032
21 ESK.V Eskay Mining Corp $2.110 https://stockcharts.com/h-sc/ui?s=ESK.V&p...2221768177
22 TUO.V Teuton Resources Corp $2.370 https://stockcharts.com/h-sc/ui?s=TUO.V&p...1926720407
23 TUD.V Tudor Gold Corp $2.710 https://stockcharts.com/h-sc/ui?s=TUD.V&p...7186783346
24 SKE.TO Skeena Resources $3.190 https://stockcharts.com/h-sc/ui?s=SKE.TO&...2377942100
25 III.TO Imperial Metals Corp $5.250 https://stockcharts.com/h-sc/ui?s=III.TO&...2125642263
26 PVG.TO Pretium Resources $13.190 https://stockcharts.com/h-sc/ui?s=PVG.TO&...0112557228
27 ELD.TO Eldorado Gold Corp $13.150 https://stockcharts.com/h-sc/ui?s=ELD.TO&...0529029750
28 SEA.TO Seabridge Gold $21.220 https://stockcharts.com/h-sc/ui?s=SEA.TO&...9592454206
Due to lack of basic infrastructure like power line and accessible roads, exploration and discoveries have been arduous in the Golden Triangle in the past decades, it took Seabridge Gold 41 years to achieve its current mineral reserves and resources since its formation in 1979. https://www.seabridgegold.com/company/overview
Thanks to Brian Kynoch, P.Eng. and President of Imperial Metals, his desire to construct a copper mine at Red Chris prompted the government to construct highway and roads and install power line through the Golden Triangle since 2012, with the basic infrastructure in place and with the progress in modern day mineral detection technology, potential rapid discovery of bonanza gold deposits in the Forrest Kerr fault zone and accurate resources estimate through 3-D imaging can be achieved.
==============================================
Aben Resources's drill assay and potential gold resource
==============================================
Being a close neighbor to Eskay Creek mine with similar geology, Forrest Kerr can potentially has similar gold deposits.
History of Eskay Creek mine, the world's massive high grade gold mine
In 1932 a prospector named Tom Mackay of Consolidated Stikine Resources was the first to recognize the area's unique geological setting after spotting an alluring rock outcrop from his single-engine bush plane. After staking the property he discovered a boulder broken free from its source higher up on the mountain, rolling several dozen meters downslope, assays from the boulder returned a spectacular five ounces of gold per tonne. Mackay explored the property for over 50 years but bonanza gold deposit was never found. In 1988 after investing in Consolidated Stikine Resources which held rights to Eskay Creek, geologist Ron Netolitzky became Stikine’s technical person and one of five controlling shareholders. He teamed up with Murray Pezim of Calpine Resources to raise $900,000 for a drill program and started exploring the area in the summer of 1990. After drilling 108 holes and with momentum building, they hit a fault. Chet Idziszek, Pezim’s geologist with a M.Sc. degree from McGill University observed gradually increasing gold grade and increasing interval length in the assays, he had an intuition that he must be very close to the main gold vein, he studied the maps and analysed the terrain then he ragged the drill rig to a spot 350 meters from the last hole drilled and drilled hole #109. Bingo, assays from hole 109 returned spectacular 27.2 g/t gold, 30.2 g/t silver over 208 meters (682 feet). In 1994 Eskay Creek went into production that lasted 14 years, finally ended in 2008. Eskay Creek had the highest grade gold on the planet and produced 3.3 million ounces of gold at a breathtaking 45 g/t Au, also 160 million ounces of silver at 2,224 g/t. Stikine Resources was acquired by Placer Dome and International Corona for $67 per share. Ron Netolitzky has had a very successful career in mining and mineral exploration with decades of experience and having been directly associated with three major mineral discoveries in Canada that have subsequently been put into production: Eskay Creek, Snip and Brewery Creek. Ron Netolitzky was inducted into the Canadian Mining Hall of Fame in 2014.
Map of Forrest Kerr and the Boundary Zone.
Aben Resources's assay and potential gold resource
https://investorshangout.com/images/MYImages/...nAssay.jpg
Newmont acquired GT Gold at $3.25 per share
https://www.gtgoldcorp.ca/_resources/news/nr_2021_03_10.pdf
Historical share price of GT Gold ( It could be Aben Resources's "Vision For The Future" ! )
https://investorshangout.com/images/MYImages/...ychart.gif
Assay comparison between GT Gold and Aben Resources
===============
Chart Technicality
===============
Chart is not only a historical record, quite often it can predict the future, it is an important trading tool, no investor can be successful without referring to charts. Trading without charts is like an airplane pilot flying without any navigation instrument but only by hunch and guessing, chances are he will end up in crash-and-burn. Head-And-Shoulder is a natural chart formation in Nature, it is the most reliable and predictable chart pattern among all chart formations.
Bullish Head-And-Shoulder pattern - fail break pattern
Bullish Head-And-Shoulder pattern in copper
Bullish Head-And-Shoulder pattern in XAU mining index
ABN.V share price future scenario
Click for enlarged view
https://investorshangout.com/images/MYImages/...04_ABN.jpg
===================================
Testament for the Golden Triangle potential
===================================
In the year 2000 I scanned several hundred long term weekly charts of mining stock companies in my search for one with promising future as I believe in charts. One chart with a bullish Head-And_Shoulder pattern immediately caught my special interest, from my diligent research, I found out that mining company had 6 billion pound of commercially viable copper resources in its Red Chris project in the Golden Triangle of British Columbia, so I bought 200,000 shares of American Bullion Minerals at 5 cents for long term investment. In the year 2011 the company was bought out by Imperial Metals at $2.40 a share, the sale offered me an early retirement. Recently I again scanned several hundred mining stock charts and again one chart stood out among others like a star shining brightly among dark matters of the Universe and has the potential of exploding into a supernova. Based on the spectacular assays in the Forrest Kerr, I have strong confidence that there are bonanza gold deposits somewhere in the property as the saying goes: When there is smoke, there is fire, similarly, the moderately long intervals of high grade gold, especially the phenomenon of visible gold is a promising sign that bonanza gold deposits may exist somewhere in Forrest Kerr, it is up to the geologists to trace them to the source: A gold vein with numerous gold arteries that can run for hundreds of meters.
Red Chris Mine (at the top right corner of the Golden Triangle)
https://investorshangout.com/images/MYImages/...ABNmap.jpg
 (0)
(0) (0)
(0)