This map uses smart thermometers to detect potenti
Post# of 128962
03-20-20CORONAVIRUS CRISIS
Using symptom and fever data, a smart thermometer company is watching for early signs of COVID-19.
https://www.fastcompany.com/90479800/this-map...d-19-cases

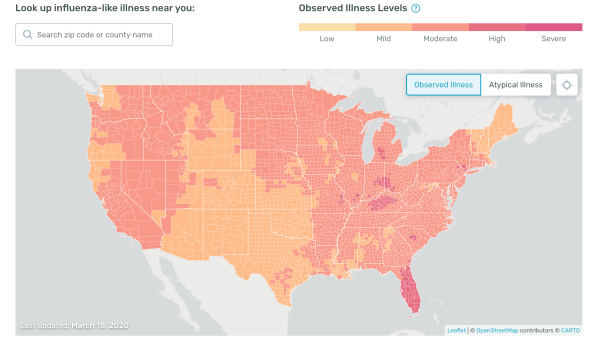
Kinsa, a smart thermometer company, has published a map tracking illness across the country. For the last five years, the company has tracked the flu down to the county level. Now, it’s using its real-time temperature data to suss out early signs of COVID-19 across the U.S.
Created in collaboration with Benjamin Dalziel, an assistant professor at Oregon State University’s department of biology, the map uses current sickness levels to predict illness weeks into the future, then it compares that projection against typical flu levels.
What that yields is a map highlighting areas where people are getting sicker than should be expected. The company refers to this latter category as “atypical illness” or unexpected outbreak. Much of the atypical illness map is gray, denoting either normal levels of illness or insufficient data. But certain areas, like Florida, are washed in red and orange.
“Now I cannot definitely tell you that the unexpected outbreak is COVID-19, but I can tell you something weird is going on here,” says Inder Singh, Kinsa’s CEO and founder. Because of the speed with which the coronavirus is spreading, there is a chance that the additional illness could be COVID-19.
However, he says that by layering in other data from public health departments or health system information about emergency room visits, the platform can know more specifically what is causing an outbreak.

[Screenshot: Kinsa, Created in collaboration with Benjamin Dalziel, Oregon State University]
“In Brooklyn, NY, we begin to see anomalous events into the second week of March,” the company notes in a blog post explaining its methods. “This provides us with guidance of where potential COVID-19 outbreaks may be occurring.”
Example plot for how this method would be used to identify potential COVID-19 outbreaks in real-time. Expected influenza forecasts are generated from a point prior to outbreak, and anomalies falling outside of the 95% confidence limit are identified each day.
Kinsa’s smart thermometer connects to an app, where users can record their temperature as well as other symptoms. The platform is HIPAA compliant, so Kinsa doesn’t see any one person’s health information. However, that data in aggregate is still quite powerful.
To date, the company has 2 million users covering 70% to 80% of the U.S. and growing. This data has allowed Kinsa to glean insights into how a virus moves from one county to another or across a state. It also shows places where an illness is taking hold in real time.
Singh says demand for thermometers have gone up dramatically; the company is selling 10,000 units per day. Kinsa thermometers sold out in the U.S. last night, but Singh says he’s expecting a shipment of 20,000 next week. He plans to have 30,000 to ship to the U.S. every week thereafter.
The company plans to update the map continuously as it gets in new data. It will also add descriptions at the bottom detailing analysis of individual areas to provide more detail on what may be causing the atypical illness. For example, one area may be experiencing an increase in a different illness, like H1N1, rather than COVID-19.
“We may need more penetration in some of these rural counties, but some of these counties have such low population it may not even be possible to get that data,” says Singh. “What I want is government support to scale up so we can detect atypical illness with incredible accuracy.”
ABOUT THE AUTHOR
Ruth Reader is a writer for Fast Company. She covers the intersection of health and technology.
 (0)
(0) (0)
(0)