CTIX Daily Chart......... Getting Closer Boun
Post# of 72451

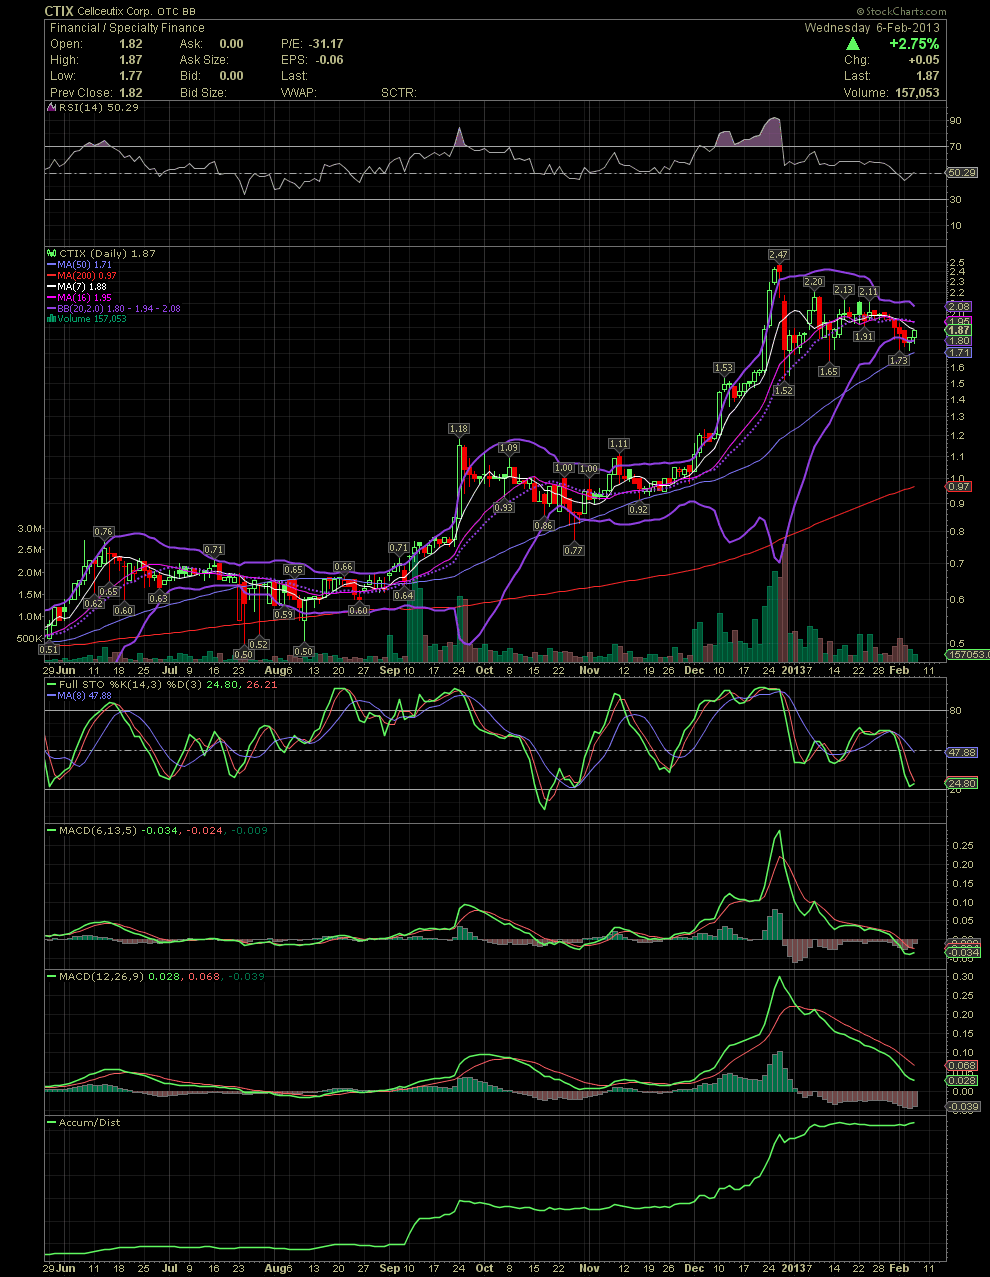
CTIX Daily Chart......... Getting Closer
Bouncing off the lower bollie and having held above the MA50, things are beginning to look a little better. The share price is sitting a penny below the MA7. The MA16 and 20 are just above at the mid 1.90s. The FullSto is at the oversold level of its 20 line. The shorter term MACD is curling up a bit. The longer term MACD has some work yet. But so far, since the initial selloff from the clearly overbought conditions of late December, the stock has put in higher lows in each of the three downward spikes of 1.52, 1.65, and 1.73. The top of the low 1.50s in early December held the selling barrage of late December. And the close of 1.73 during the bear raid of Dec 28 hasn't been breached since. Close but not taken out. Not sure if a bottom is in yet, but it appears that it could be. We'll find out shortly. GLTA

 (0)
(0) (0)
(0)