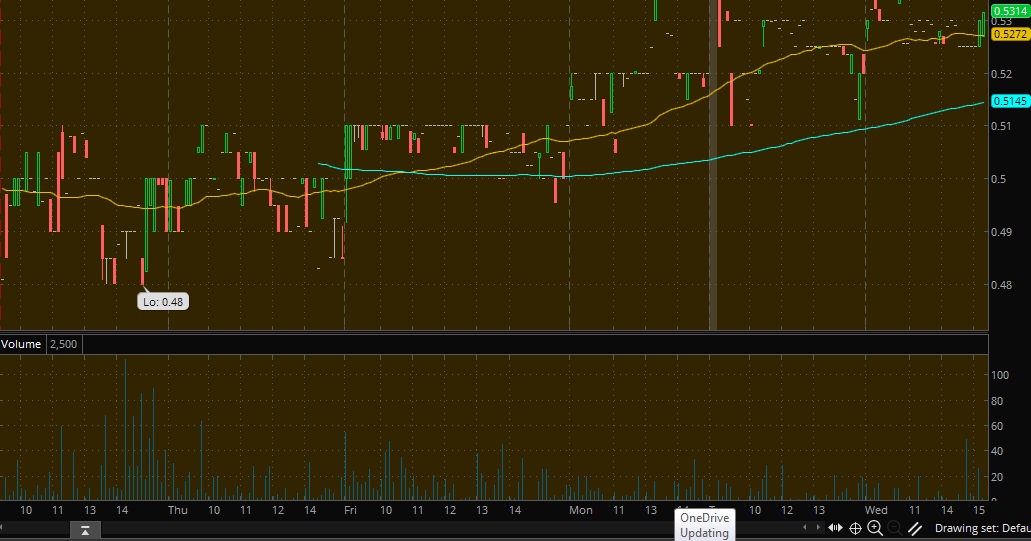
I use the 1, 5, 15 min chart to see current moveme
Post# of 157666
(Total Views: 395)
Posted On: 02/06/2019 4:54:26 PM

I use the 1, 5, 15 min chart to see current movement. 50x200 period crossed for 1 and 5 min on Friday and 15 min on Monday. Still looking good on the 5 min here:
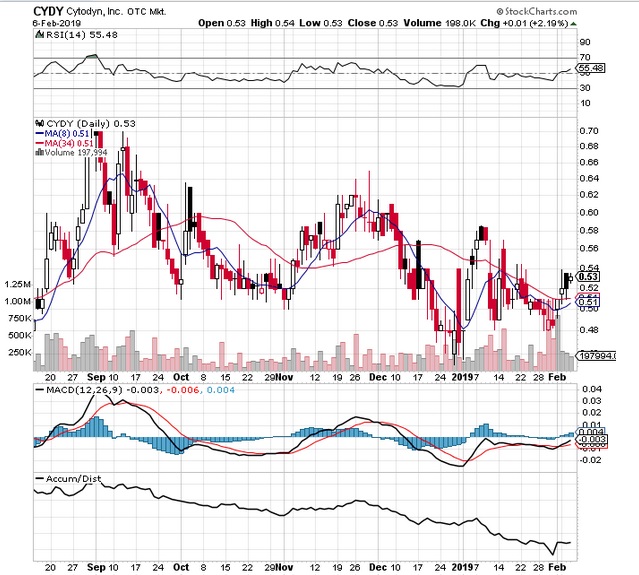
On 30min, macd turned up, we may get a 8x34 crossing, notice 8x34 touched last month but didn't cross, acc/dis increasing, rsi still has room to run. If the sellers will slowing sell as we move up, as they have been doing, we will continue to climb.
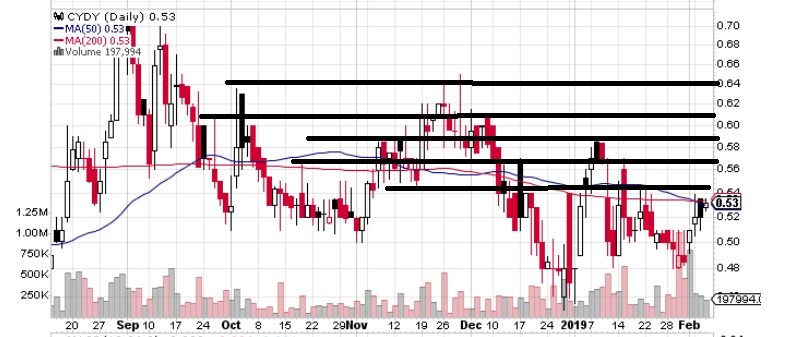
50x200 day both at 53c. Some key resistance coming up, 54, 56, 58, 64
54 also on sars before the flip and upper bb is 55 resistance.
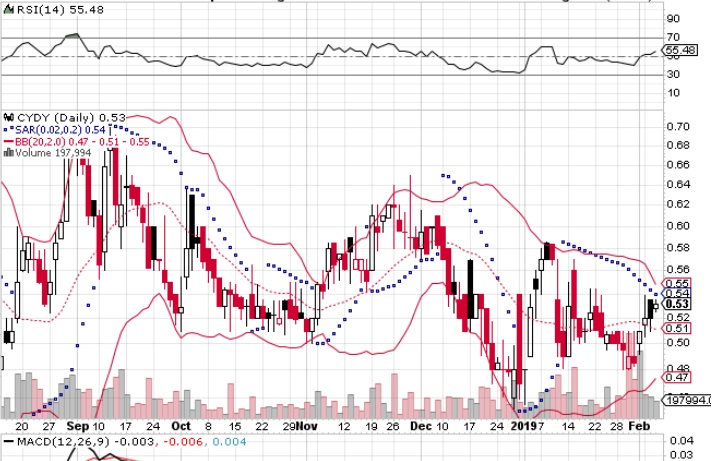
So watching close here around the 54-56 resistance levels, the 50x200 on the 1 min or 5 min should tell us before. Also the vwap, but I've posted enough charts for one day.
On 30min, macd turned up, we may get a 8x34 crossing, notice 8x34 touched last month but didn't cross, acc/dis increasing, rsi still has room to run. If the sellers will slowing sell as we move up, as they have been doing, we will continue to climb.
50x200 day both at 53c. Some key resistance coming up, 54, 56, 58, 64
54 also on sars before the flip and upper bb is 55 resistance.
So watching close here around the 54-56 resistance levels, the 50x200 on the 1 min or 5 min should tell us before. Also the vwap, but I've posted enough charts for one day.
 (0)
(0) (0)
(0)