Now this a bit heady but Bond Market Sends Up a
Post# of 99581
(Total Views: 189)
Posted On: 12/05/2018 6:06:13 PM

Now this a bit heady but
Bond Market Sends Up a Recession Warning Flare
< >
Part of the yield curve inverted on Monday, the first time this has happened since 2007.
That sent jitters through the stock market as investors worried it could foreshadow slower growth or even a recession in the future. The Dow Jones Industrial Average fell by 600 points, or 2.32 percent, on Tuesday morning.
The yield curve is a way to show the difference in compensation investors get depending on how long a bond takes to mature. Most of the time, the curve slopes upward because investors usually want to be paid more in exchange for locking their money up for longer.
But at times the relationship can flip, or invert, with shorter-term bonds yielding more than longer-term bonds.
That’s what happened on Monday and Tuesday. First, the yield on five-year Treasurys dipped below three-year Treasurys. That was closely followed by the five-year yield falling below two-year yields.
This can be an indicator that investors think the Federal Reserve will have to cut its short-term interest rate target because of slumping economic growth or an approaching recession.
In other words, the inversion is the latest piece of evidence that the Federal Reserve may be acting too aggressively in raising interest rates. Although the economy has many areas of strength, particularly in the labor market and manufacturing sector, the more interest-sensitive areas–such as housing and autos–have been weak.
The last time the three-year yield fell below the five-year, the economy slipped into a recession in the following year. Recessions also followed similar inversions in 1990 and 2001.
But the crystal ball of the yield curve is murky. Bespoke Investment Group said in the last three recessions the first inversion of three-year and the five-year yields came an average 26.3 months before the start of a recession, with a range between 17 and 38 months.
And an inverted yield curve does not always predict a recession. The gap between the two-year and five-year yields turned negative in 1998, for example, but no recession followed until after the gap between the two-year and 10-year yield inverted in 2000.
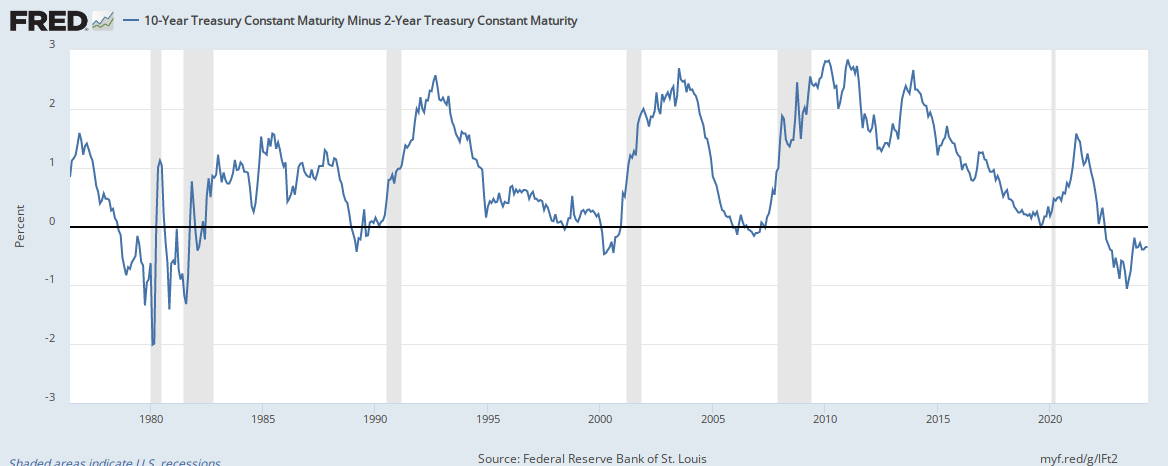
When the gap between the 10-year Treasurys and 2-year turns negative, the yield curve is said to be inverted. This can indicate a recession is approaching.
The most closely watched parts of the curve are the gaps between the two-year to ten-year yield curve and the three-month to ten-year curve. These are thought to be the best predictors of a recession. Studies by Federal Reserve economists say we should pay particular attention to the three-month to ten-year gap. And these are still positive, although the gap is narrowing as the yield on ten-year Treasurys has fallen further than short-term yields.
The 2-year yield Tuesday was around 12 basis points–each basis point is a one-hundredth of a percentage point–below the 10-year yield, while the 3-month yield was about 50 basis points below from the 10-year.
History suggests that a temporary inversion in discrete parts of the curve is not all that predictive. Nor does a flatter yield curve have much predictive power. So if the three-month and two-year yields stay above the ten-year, a slump or recession may not be in the offing.
The yield curve may also have lost some of its predictive power. Very large budget deficits have increased the amount of bonds the government is selling. The government’s choices about which bonds to sell could cause an over-supply or under-supply in some parts of the yield curve, which in turn could invert the curve.
The Federal Reserve’s actions as it shrinks its balance sheet, inflated from years of bond buying under the central bank’s quantitative easing program, may also be putting pressure on the curve. This is largely an unprecedented event so its effects are hard to predict and likely will not be known for years.
The bond market is often fickle. In the early months of this year, the market was signaling that the Fed was expected to raise interest rates three times in 2019. Now it sees rates rising once or, possibly, twice.
Bond Market Sends Up a Recession Warning Flare
< >
Part of the yield curve inverted on Monday, the first time this has happened since 2007.
That sent jitters through the stock market as investors worried it could foreshadow slower growth or even a recession in the future. The Dow Jones Industrial Average fell by 600 points, or 2.32 percent, on Tuesday morning.
The yield curve is a way to show the difference in compensation investors get depending on how long a bond takes to mature. Most of the time, the curve slopes upward because investors usually want to be paid more in exchange for locking their money up for longer.
But at times the relationship can flip, or invert, with shorter-term bonds yielding more than longer-term bonds.
That’s what happened on Monday and Tuesday. First, the yield on five-year Treasurys dipped below three-year Treasurys. That was closely followed by the five-year yield falling below two-year yields.
This can be an indicator that investors think the Federal Reserve will have to cut its short-term interest rate target because of slumping economic growth or an approaching recession.
In other words, the inversion is the latest piece of evidence that the Federal Reserve may be acting too aggressively in raising interest rates. Although the economy has many areas of strength, particularly in the labor market and manufacturing sector, the more interest-sensitive areas–such as housing and autos–have been weak.
The last time the three-year yield fell below the five-year, the economy slipped into a recession in the following year. Recessions also followed similar inversions in 1990 and 2001.
But the crystal ball of the yield curve is murky. Bespoke Investment Group said in the last three recessions the first inversion of three-year and the five-year yields came an average 26.3 months before the start of a recession, with a range between 17 and 38 months.
And an inverted yield curve does not always predict a recession. The gap between the two-year and five-year yields turned negative in 1998, for example, but no recession followed until after the gap between the two-year and 10-year yield inverted in 2000.
When the gap between the 10-year Treasurys and 2-year turns negative, the yield curve is said to be inverted. This can indicate a recession is approaching.
The most closely watched parts of the curve are the gaps between the two-year to ten-year yield curve and the three-month to ten-year curve. These are thought to be the best predictors of a recession. Studies by Federal Reserve economists say we should pay particular attention to the three-month to ten-year gap. And these are still positive, although the gap is narrowing as the yield on ten-year Treasurys has fallen further than short-term yields.
The 2-year yield Tuesday was around 12 basis points–each basis point is a one-hundredth of a percentage point–below the 10-year yield, while the 3-month yield was about 50 basis points below from the 10-year.
History suggests that a temporary inversion in discrete parts of the curve is not all that predictive. Nor does a flatter yield curve have much predictive power. So if the three-month and two-year yields stay above the ten-year, a slump or recession may not be in the offing.
The yield curve may also have lost some of its predictive power. Very large budget deficits have increased the amount of bonds the government is selling. The government’s choices about which bonds to sell could cause an over-supply or under-supply in some parts of the yield curve, which in turn could invert the curve.
The Federal Reserve’s actions as it shrinks its balance sheet, inflated from years of bond buying under the central bank’s quantitative easing program, may also be putting pressure on the curve. This is largely an unprecedented event so its effects are hard to predict and likely will not be known for years.
The bond market is often fickle. In the early months of this year, the market was signaling that the Fed was expected to raise interest rates three times in 2019. Now it sees rates rising once or, possibly, twice.
 (0)
(0) (0)
(0)