Excellent Q3 report AND update from SB! Waldoht
Post# of 40992
(Total Views: 485)
Posted On: 09/15/2018 8:29:09 PM
Re: MoneyForNuthin #17561
Excellent Q3 report AND update from SB!
Waldo will be finding some GREAT THINGS to point out I'm sure!
Waldo
will be finding some GREAT THINGS to point out I'm sure! Quote:
The actual per-unit profit is much higher than the $30 in your example. The following numbers come directly from actual numbers from ONCI financial reports (summarized in the table at the bottom of this post)
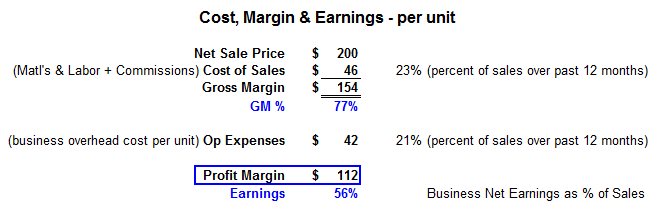
So the actual per-unit profit is $112.
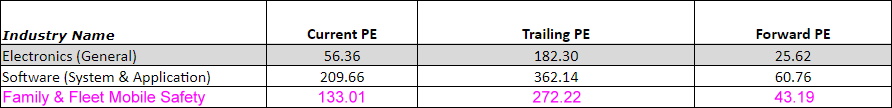
I'm going to use PE (Price to Earnings) ratios derived from ratios provided by NYU Stern School of Business.
(there's more info about this sort of valuation in my post from April 4: ONCI Valuation https://investorshub.advfn.com/boards/read_ms...139774173)
The product is mostly software, but does include a hardware electronics component. So I chose the midpoint between the electronics and software PE ratios from NYU Stern School of Business (widely accepted industry ratios, updated frequently and recognized throughout the financial community), and I called it "Family & Fleet Mobile Safety." It could easily be looked at with heavier weight on the software end, which would give higher PE ratios, but this is a good conservative approach, IMO.
Electronics & Software PE ratios from NYU Stern School of Business:
"In 2015, there were 205 million cars insured in the US..." (probably a higher number now, 3 years later?)
Okay, so let's start by limiting this to U.S. sales only, even though the Company already has a lot of activity in several other countries.
Let's say that, next year or the year after, ONCI sells enough units to outfit 1/10th of 1% of the vehicles insured in the U.S. That's a very small part of the market, right?
Based on the 2015 number of 205 million cars, that would give us (205M / 100) / 10 = 205,000 units.
At 205,000 units and $200 per unit, that comes to $41,000,000 in sales (revenue).
At $112 profit (earnings) per unit, that comes to 205,000 x 112 = $22,960,000 in EARNINGS.
So, in a given year, ONCI sells enough units to outfit 1/10th... of 1%... of the insured vehicles in the U.S. (and we know there are just a few more vehicles in OTHER countries that we might be selling for, right?). It sure feels conservative to me. And that yields $23 million in earnings. Yes, that's EARNINGS, bottom line dollars.
Once that has been accomplished, we can use the Trailing PE number - as is most frequently used for valuations - and that gives us a valuation of $22,960,000 x 272.22 = $6,250,171,200. That's $6.25 with a B behind it - $6.25 billion. Seems outrageously high, doesn't it? Well, that's why software/app businesses do so well in the stock market. With the O/S reduced by 1.4B, we'll have something like 3.1B O/S. A $6.25B valuation with 3.1B O/S gives $6.25B / 3.1B = $2.02 pps.
Okay, so that's at least another year before we could claim that valuation, right?
But what if we want to look at a projection of future sales/earnings, saying that over the next year ONCI will sell 205,000 units? Okay, so we use the Forward PE, which gives us a valuation of $22,960,000 x 43.19 = $991,642,400. At 3.1B O/S, we get $991,642,400 / 3.1B = $0.32 pps.
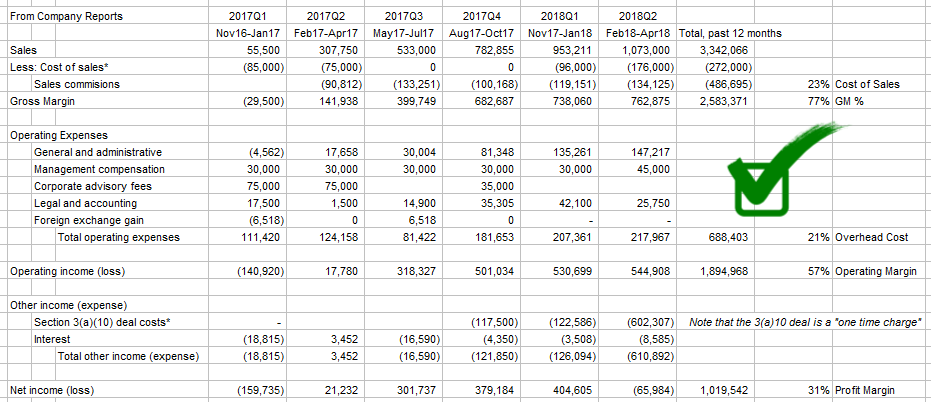
If we go with just what we have today, before seeing the revenue from the past quarter that is going to show in the quarterly report in 2-3 weeks, and before we see the sales that are just beginning with AutoNation and CarMax, and before CNA pushes our product to the NUCA membership, and before we see the first large fleet deal, and before we see a private label deal that seems to be in the works... Then let's go with what we have TODAY, from the past 4 quarters operating margin, which is $1,894,968.
So... using the Trailing PE number, which is most commonly used, TODAY we have a valuation of $1,894,968 x 272.22 = $515,848,189.
And... at 3.1B O/S, this gives us $515,848,189 / 3.1B = $0.17 pps.
I went with Operating Margin for the "earnings" number because the only difference between the Operating Margin and Profit in this case is the costs for the 3(a)10 debt restructuring, which is a one-time charge for extinguishing old debt from old management that was not part of this business/product financial model.
But remember what we started with - we considered sales ONLY in the U.S., and we said the quantity sold is for 1/10th of 1% of the insured vehicles in the U.S. When, in fact, we have much activity going on outside of the U.S. and, within the U.S. we are developing a huge network of vehicle dealerships, working with large-fleet companies across the country, working on OEM deals, private-label deals and insurance company deals. So it's very possible that the 1/10th of 1% - or 205,000 vehicles - will look like a real lowball annual sales number in the very near future.
 (3)
(3) (0)
(0)