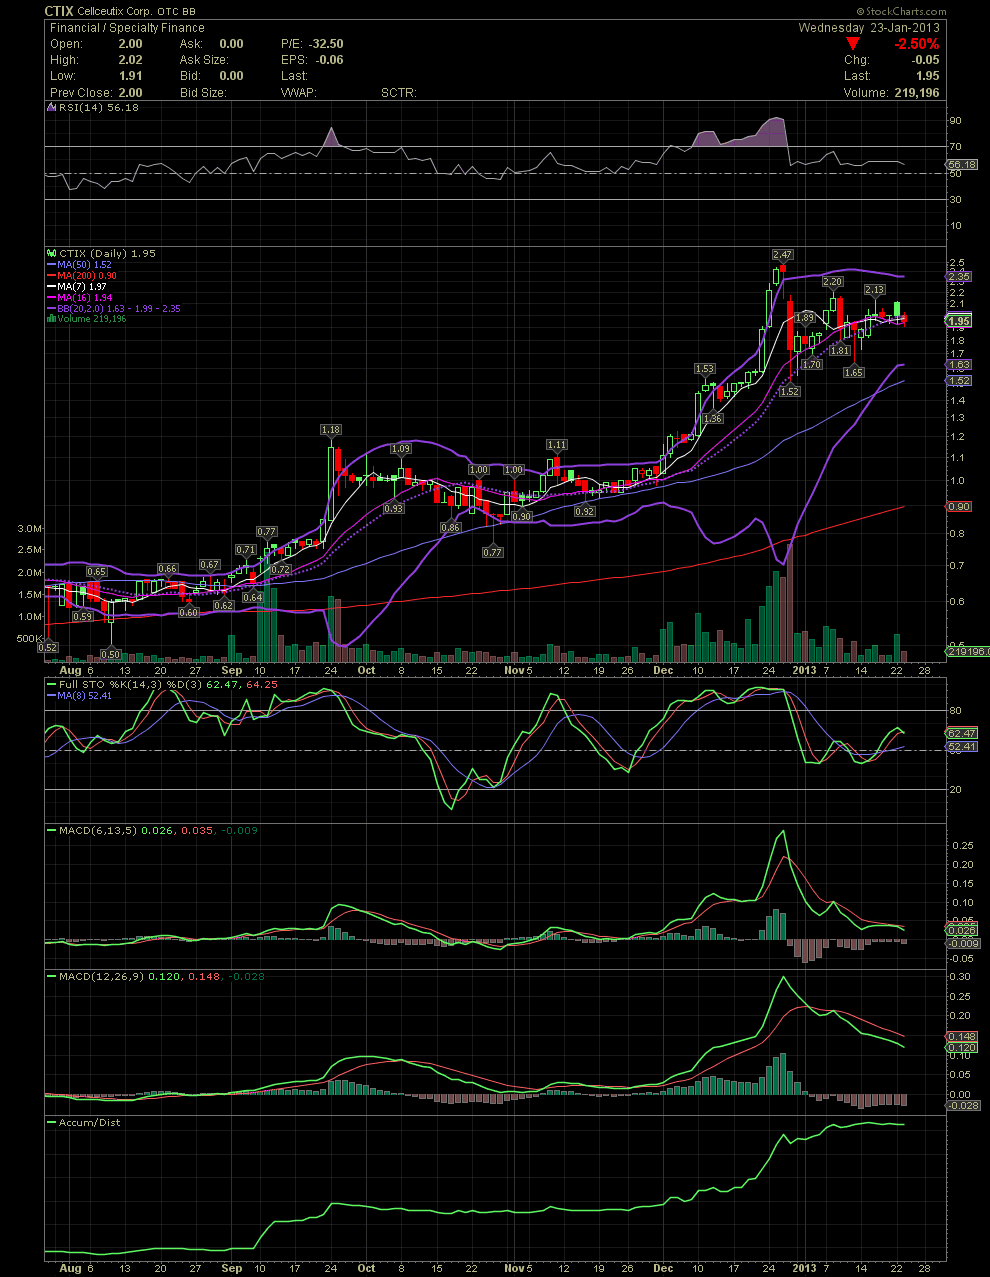
CTIX Daily Chart............ Consolidation Continu
Post# of 72451
CTIX Daily Chart............ Consolidation Continues
Here's what I sent out to a few friends a couple of hours ago. Nothing much changed on the chart as CTIX is simply churning since the bear raid of last month. All the Moving Averages from the MA7, 10, 16 and 20 are very close to each other at the 1.94 to 1.99 levels. A move, with volume, puts the stock price above all the MAs. During the last four weeks, the RSI, FullSto, and MACDs have corrected from their extremely overbought conditions when the share price was way outside the upper bollie. The MACDs have some work to do. But the accumulation continues as you can see on the A/D line. As most everyone knows, News will always trump technicals. And this evening's news should put the the stock into a renewed leg upwards, so the chart will follow the fundamental news this time around. I would look at horizontal resistance lines of 2.13, 2.20, and 2.47. Clear that 2.47 and it's obviously another breakout to the upside as we saw at .78, 1.18, and 1.53. I rather see it done slow and steady so as not to invite all the flippers and shorts. But heck, in the long run, it won't matter anyway. Allow the flippers to make their 10-20% while the patient longs make 100s of percent. GLTA

 (0)
(0) (0)
(0)