RXMD IS ON A COURSE FOR SUCCESS, ON OTCQB and NASD
Post# of 1525
(Total Views: 1845)
Posted On: 05/21/2018 4:41:19 PM
RXMD IS ON A COURSE FOR SUCCESS, ON OTCQB and NASDAQ
OUTLOOK FOR 2018: Completion of TWO REVENUE PRODUCING ACQUISTIONS
OUTLOOK FOR 2019: SEC Reporting Compliance, NASDAQ Uplist, and more ACQUISITIONS
ALL POINTS TO CONTINUED DEVELOPMENT AND GROWTH THROUGH EXPANSION
INVEST WISELY
HERES SOME JUICY 2018 NUMBERS W/O NEW LOCATION ACQUIRED 3/30/18
Scripts: 87,300 a 26% increase compared to April 30, 2017
Net Revenue: $6.75 million, a $400,000+ increase compared to April 30, 2017
340B Sales: $1.8 million, a $1.1 million+ increase compared to April 30, 2017
KEY PHARMACIST COMPENSATION SAVINGS: $473,000 estimated for 2018
Management restructured Key Pharmacist agreement October 1, 2017 to reduce costs, which resulted in a savings of $173,000 compared to last year as recognized in 1st Quarter Results with this F/S Note: During the three months ended March 31, 2018 and 2017, payments to the pharmacist were approximately $87,000 and $260,000, respectively. $87K x 4 = $348 compared to FY 2017 of $821K. This puts us on pace for savings of over $473,000 for 2018
Let’s Take a Very Close Look with the Eyeball on 1st Quarter Results
So we reported $(642,000) Loss.
What really makes up that Loss and Is True Profitability Reflected.
Let’s start from the Net Loss and then dive into the expenses and see what’s really related to Operations.
 This completely agrees with F/S information below, which doesn’t take it as far to perform the addbacks to assess RXMD’s true profitability.
Then let’s observe increase in revenue last year. JUST KEEPS INCREASING YOY
Then check out increase in revenue from the last 2 years.
Overall
G - FY 2013 = $9.3 million
R - FY 2014 = $11.3 million
O - FY 2015 = $13.7 million
W - FY 2016 = $18.3 million
T - FY 2017 = $20.1 million
H - FY 2018 = $6.8 million (4 months) does not include 340B revenues
LET'S TALK ABOUT INCOME FROM PREVIOUS YEARS
Shall We . . .
FY 2017 = $49,251 Net Income, and w/o Discontinued Operations Net Income is $139,251
FY 2016 = $209,319 Net Income, and w/o Discontinued Operations Net Income is $259,319
Yes it did go down by $150,000, but quite explainable with $90,000 from discontinued operations and the information detailed below and still extraordinary when you consider the improvement from 2015 and 2014,
FY 2015 = $(1,219,000) Net Loss
FY 2014 = $(1,009,000) Net Loss
Now let’s analyze where some of expenses effecting additional net income has been applied to development, growth, and expansion initiatives. Growing, Growing, Growing. Everything says they are using money to GROW.
Available Cash Is Building Up !!!
End Of 2017 = $419,000 1st Qtr 2018 = $1,261,000 Million
FY 2017 A/R = $1,270,114 1st Qtr 2018 = $1,128,000
Cash and A/R Combined Cash Assets
December 31, 2017 = $1,689,000
March 31, 2018 = $2,389,000
In awesome position, although a portion will go to acquisition. An increase of over $700K in cash assets and $1.2 million overall in cash assets.
EVERYTHING IS MOVING FORWARDS AND LOOKING GREAT !!!
Another Acquisition Scheduled for 2018
Another Acquisition, SEC Reporting Compliance, and NASDAQ Uplifting for early 2019
SHORT TERM PRICE TARGET $.35
OUTLOOK FOR 2018: Completion of TWO REVENUE PRODUCING ACQUISTIONS
OUTLOOK FOR 2019: SEC Reporting Compliance, NASDAQ Uplist, and more ACQUISITIONS
ALL POINTS TO CONTINUED DEVELOPMENT AND GROWTH THROUGH EXPANSION
INVEST WISELY
HERES SOME JUICY 2018 NUMBERS W/O NEW LOCATION ACQUIRED 3/30/18
Scripts: 87,300 a 26% increase compared to April 30, 2017
Net Revenue: $6.75 million, a $400,000+ increase compared to April 30, 2017
340B Sales: $1.8 million, a $1.1 million+ increase compared to April 30, 2017
KEY PHARMACIST COMPENSATION SAVINGS: $473,000 estimated for 2018
Management restructured Key Pharmacist agreement October 1, 2017 to reduce costs, which resulted in a savings of $173,000 compared to last year as recognized in 1st Quarter Results with this F/S Note: During the three months ended March 31, 2018 and 2017, payments to the pharmacist were approximately $87,000 and $260,000, respectively. $87K x 4 = $348 compared to FY 2017 of $821K. This puts us on pace for savings of over $473,000 for 2018
Let’s Take a Very Close Look with the Eyeball on 1st Quarter Results
So we reported $(642,000) Loss.
What really makes up that Loss and Is True Profitability Reflected.
Let’s start from the Net Loss and then dive into the expenses and see what’s really related to Operations.
This completely agrees with F/S information below, which doesn’t take it as far to perform the addbacks to assess RXMD’s true profitability. Quote:
For the three months ended March 31, 2018, the Company increased overall revenue from continuing operations to approximately $5.1 million, which resulted in 7% organic revenue growth over the same period in 2017. Gross profit margins decreased from 31% in 2017 to 23% in 2018, an 8% decrease when compared to 2017. Operating income decreased by approximately $390,000 in 2018 as compared to 2017. Annual gross margin in 2018 was negatively impacted by increased DIR fees of approximately $146,000 that the Company records as a component of cost of sales, as well as a decrease in gross margin from the Company’s compounding products. The Company’s net loss for 2018 was negatively impacted by the incremental increase in DIR fees; an amortized charge to operations of approximately $142,000 related to share-based compensation paid to officers, directors and employees; a non-operating loss of approximately $451,000 related to the change in fair value of the derivative liability from the embedded conversion feature in the Chicago Venture Partners note payable; and an increase in personnel associated with the continued growth and development of the Company.
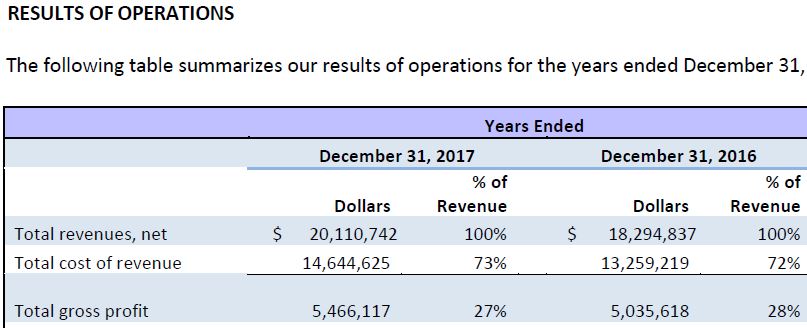
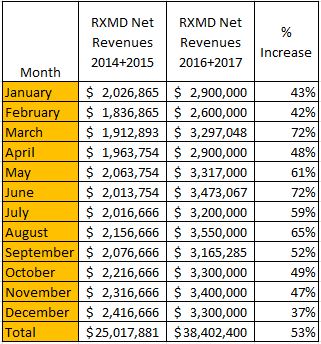
Then let’s observe increase in revenue last year. JUST KEEPS INCREASING YOY
Then check out increase in revenue from the last 2 years.
Overall
G - FY 2013 = $9.3 million
R - FY 2014 = $11.3 million
O - FY 2015 = $13.7 million
W - FY 2016 = $18.3 million
T - FY 2017 = $20.1 million
H - FY 2018 = $6.8 million (4 months) does not include 340B revenues
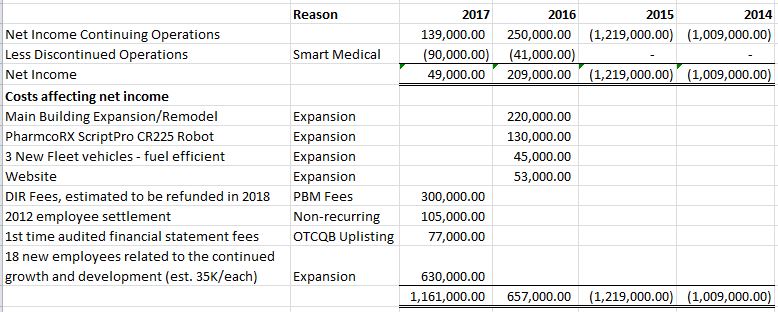
LET'S TALK ABOUT INCOME FROM PREVIOUS YEARS
Shall We . . .
FY 2017 = $49,251 Net Income, and w/o Discontinued Operations Net Income is $139,251
FY 2016 = $209,319 Net Income, and w/o Discontinued Operations Net Income is $259,319
Yes it did go down by $150,000, but quite explainable with $90,000 from discontinued operations and the information detailed below and still extraordinary when you consider the improvement from 2015 and 2014,
FY 2015 = $(1,219,000) Net Loss
FY 2014 = $(1,009,000) Net Loss
Now let’s analyze where some of expenses effecting additional net income has been applied to development, growth, and expansion initiatives. Growing, Growing, Growing. Everything says they are using money to GROW.
Available Cash Is Building Up !!!
End Of 2017 = $419,000 1st Qtr 2018 = $1,261,000 Million
FY 2017 A/R = $1,270,114 1st Qtr 2018 = $1,128,000
Cash and A/R Combined Cash Assets
December 31, 2017 = $1,689,000
March 31, 2018 = $2,389,000
In awesome position, although a portion will go to acquisition. An increase of over $700K in cash assets and $1.2 million overall in cash assets.
EVERYTHING IS MOVING FORWARDS AND LOOKING GREAT !!!
Another Acquisition Scheduled for 2018
Another Acquisition, SEC Reporting Compliance, and NASDAQ Uplifting for early 2019
SHORT TERM PRICE TARGET $.35
 (2)
(2) (0)
(0)