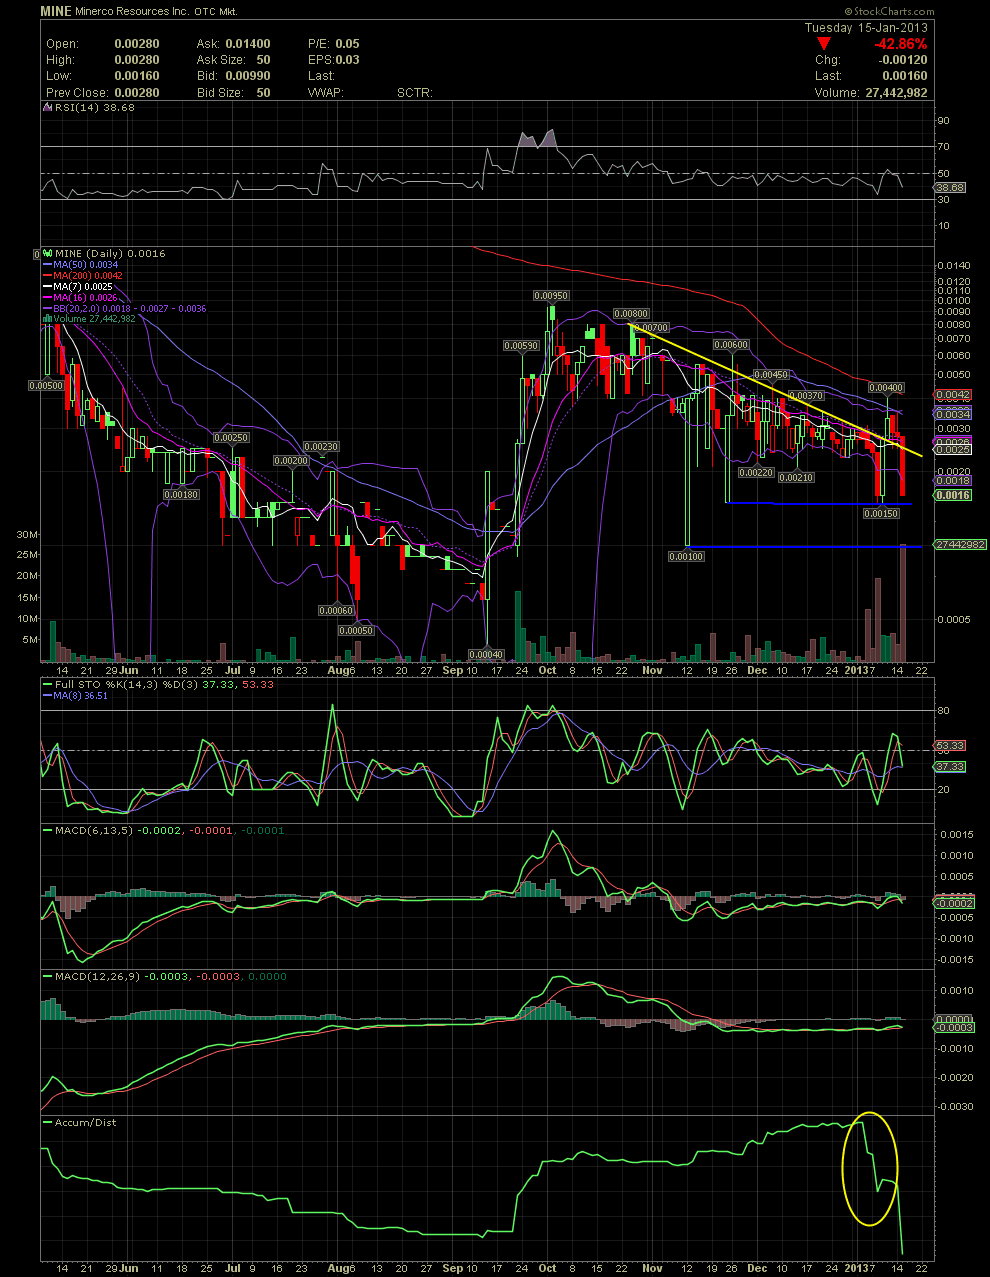
MINE Daily Chart.......... After last weeks bounce
Post# of 94330

MINE Daily Chart.......... After last weeks bounce of the .0015 and a minor breakout, the stock price hit the upper bollie and the MA50. That was a good exit for the extreme short term. Began to accumulate a few again yesterday in the upper .001s. Now we'll see if that near triple bottom will hold. I'm keeping the declining tops line on the chart as the failed breakout brought the stock price back under that resistance line. Looking at the AD line, it appears that some very large shareholders, or company, has been dumping a lot of stock. Hearing good things about the company's future, so these levels should offer a reasonable opportunity for some nice upside shortly.

 (0)
(0) (0)
(0)