Investors Hangout Stock Message Boards Logo
  • Mailbox
  • Favorites
  • Boards
    • The Hangout
    • NASDAQ
    • NYSE
    • OTC Markets
    • All Boards
  • Whats Hot!
    • Recent Activity
    • Most Viewed Boards
    • Most Viewed Posts
    • Most Posted
    • Most Followed
    • Top Boards
    • Newest Boards
    • Newest Members
  • Blog
    • Recent Blog Posts
    • Recently Updated
    • News
    • Stocks
    • Crypto
    • Investing
    • Business
    • Markets
    • Economy
    • Real Estate
    • Personal Finance
  • Market Movers
  • Interactive Charts
  • Login - Join Now FREE!
  1. Home ›
  2. Stock Message Boards ›
  3. Stock Boards ›
  4. Mindpix Corporation (MPIX) Message Board

MPIX Daily Chart......... Oh So Close Now to the N

Message Board Public Reply | Private Reply | Keep | Replies (1)                   Post New Msg
Edit Msg () | Previous | Next


Post# of 5570
Posted On: 01/16/2013 12:46:13 AM
Avatar
Posted By: Big Tuna

MPIX Daily Chart......... Oh So Close Now to the Next Leg Up


Good Morning Cube, GreenFever, JohnnyB, and all you silent MPIX shareholders! Hoping that the consolidation and churning is just about over, as I'm sure just everyone else is hoping for the same. Nothing changed much from yesterday's chart. Still seeing the once daily share swap. The bidwhacking has reduced dramatically this week as compared to the last four weeks. My guess is that most of those that wanted to move on due to need, boredom, nervousness or considering MPIX simply dead money, have probably done so for the most part.


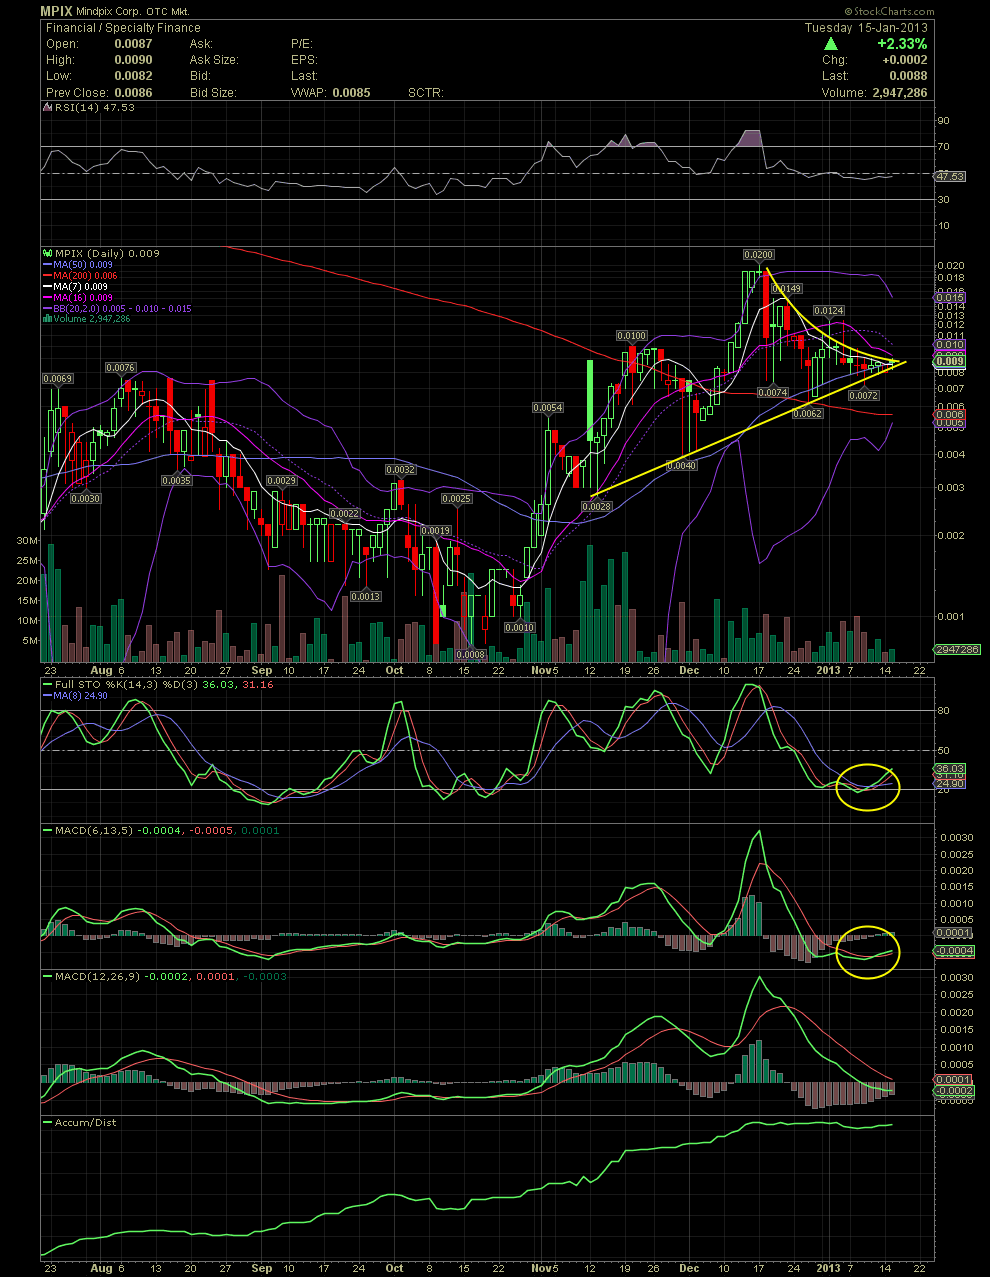
As to a few technicals, the share price is sitting just above the MA7 and just under the MA16. Maybe it will take another day or two of sideways movement before the 16 is at the mid .008s to .0089 level of the last few days. The middle bollie, or MA20 is dropping quickly now reflecting the weakness of the last twenty trading days. The stock price has been holding the rising MA50 too. The next three trading days should bring both the 16 and 20 in line or close to the .009 tag. A move by Friday to the .01 level would be a good thing in my view. The FullSto and faster MACD have crossed to the upside, also a good thing. The slower MACD has leveled out, and a move to approx .0095 should bring the Histogram to the zero line with a cross of the signal and indicator lines to the upside, yet another good thing. The upper and lower bollies are beginning to tighten. The tighter they get suggests nothing more than a move in either direction will occur. I'm still banking on a sharp move to the upside when we finally get news as the accumulation of MPIX has been very strong. That curved declining tops line has proven to be resistance during the entire decline and consolidation, and a few of you were probably ROTFL when I first suggested that it is a technical pattern. One just has to keep an open mind to trading patterns that repeat themselves on numerous charts. Look for a break out of this pattern as early as tomorrow.


Hoping for a nice few days and weeks ahead. GLTA


(0)
(0)


Mindpix Corporation (MPIX) Stock Research Links


  1.  
  2.  


  3.  
  4.  
  5.  


Investors Hangout

Home

Mailbox

Message Boards

Favorites

Whats Hot

Blog

Settings

Privacy Policy

Terms and Conditions

Disclaimer

Contact Us

Whats Hot

Recent Activity

Most Viewed Boards

Most Viewed Posts

Most Posted Boards

Most Followed

Top Boards

Newest Boards

Newest Members

Investors Hangout Message Boards

Welcome To Investors Hangout

Stock Message Boards

American Stock Exchange (AMEX)

NASDAQ Stock Exchange (NASDAQ)

New York Stock Exchange (NYSE)

Penny Stocks - (OTC)

User Boards

The Hangout

Private

Global Markets

Australian Securities Exchange (ASX)

Euronext Amsterdam (AMS)

Euronext Brussels (BRU)

Euronext Lisbon (LIS)

Euronext Paris (PAR)

Foreign Exchange (FOREX)

Hong Kong Stock Exchange (HKEX)

London Stock Exchange (LSE)

Milan Stock Exchange (MLSE)

New Zealand Exchange (NZX)

Singapore Stock Exchange (SGX)

Toronto Stock Exchange (TSX)

Contact Investors Hangout

Email Us

Follow Investors Hangout

Twitter

YouTube

Facebook

Market Data powered by QuoteMedia. Copyright © 2025. Data delayed 15 minutes unless otherwise indicated (view delay times for all exchanges).
Analyst Ratings & Earnings by Zacks. RT=Real-Time, EOD=End of Day, PD=Previous Day. Terms of Use.

© 2025 Copyright Investors Hangout, LLC All Rights Reserved.

Privacy Policy |Do Not Sell My Information | Terms & Conditions | Disclaimer | Help | Contact Us