$GCEI ~ Technicals Looking Good My Investors Ha
Post# of 2561

My Investors Hangout MVP Contest pick for this week is GCEI . Not much to discuss that hasn't already been talked about, as we continue to wait for news from the company. The chart and technicals look rather interesting though.
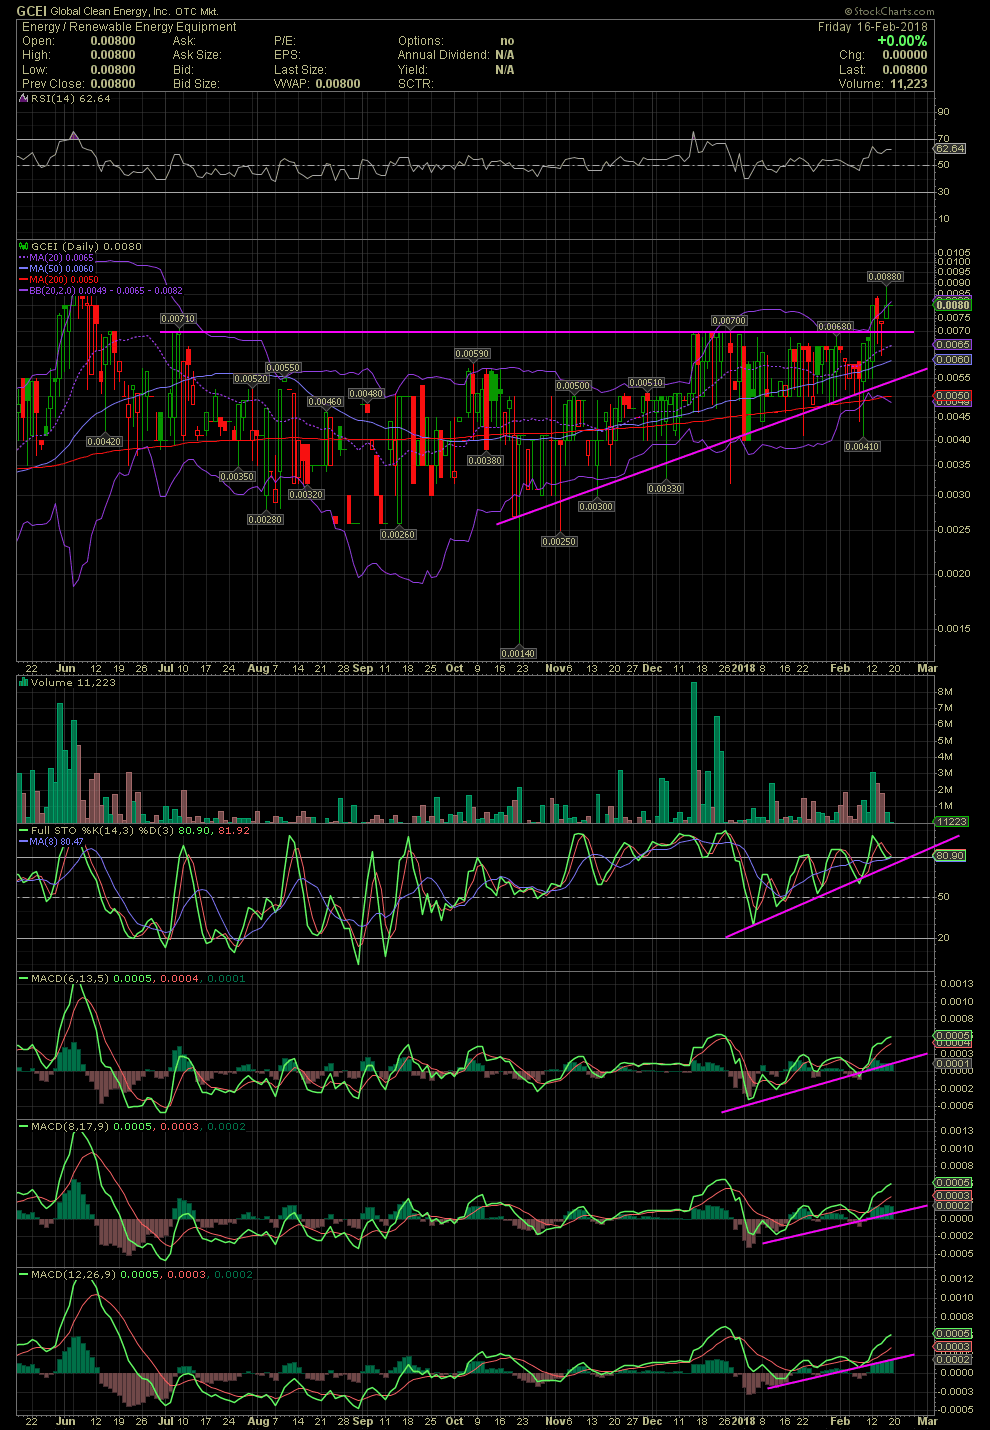
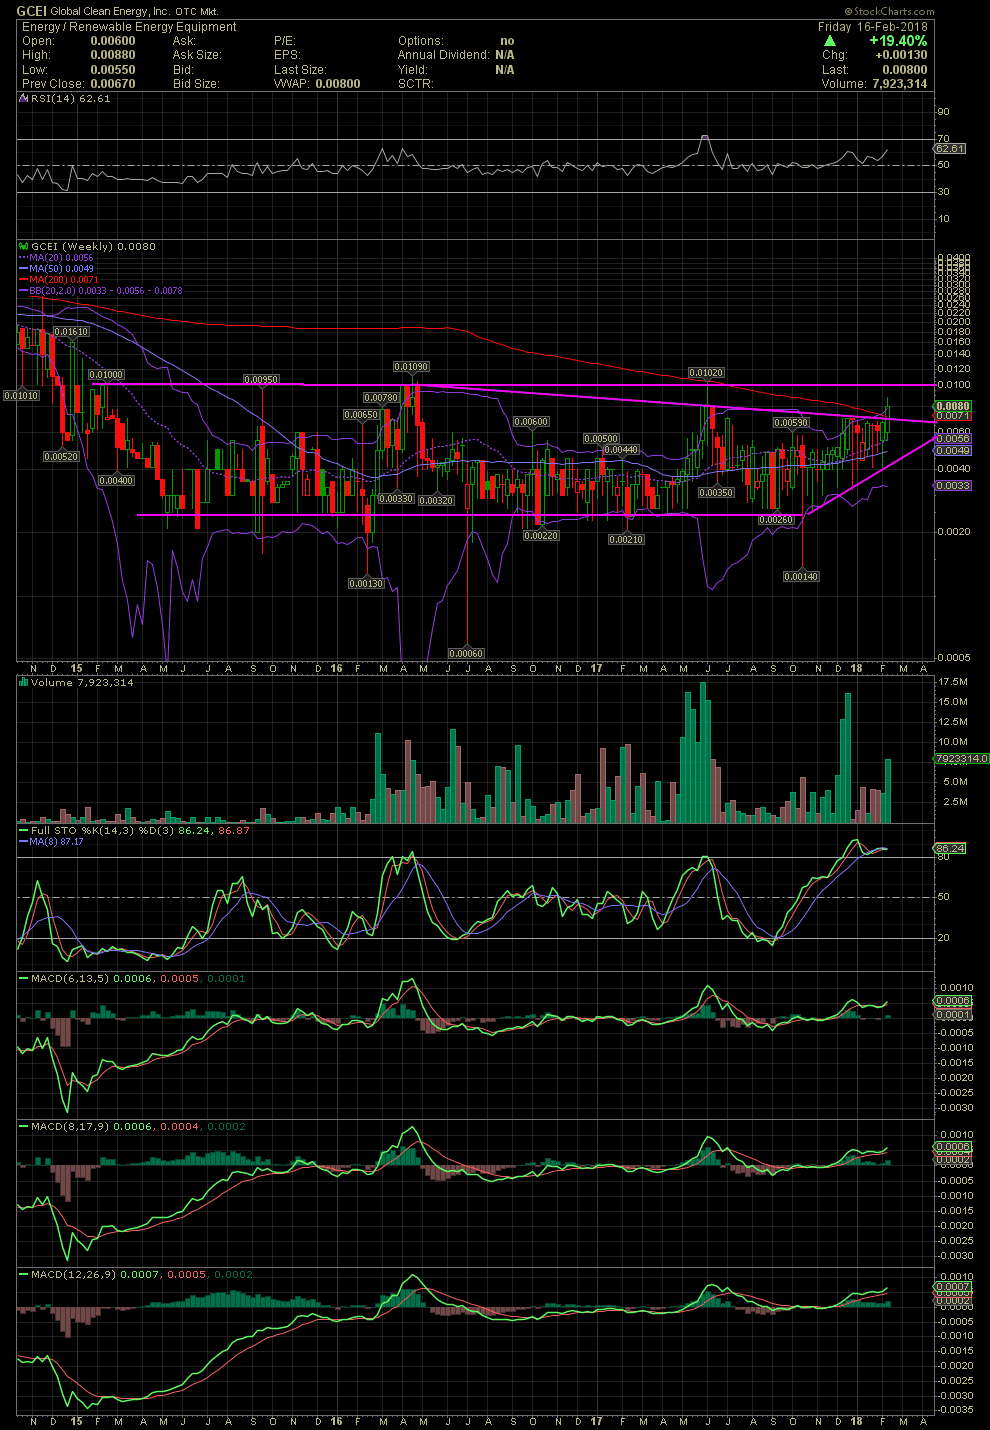
Below, I've posted the Daily and Weekly charts. As one can see on the first chart, the stock price broke out above the multi-month, horizontal, resistance line at .007, which has been in place since July 2017. The rising support line began in place since October and continues to offer support into last week. The technical indicators are currently in a positive crossover with good divergence to the upside. The second chart is a Weekly view of the stock. It shows the trading over a 3 year period since Feb 2015. The trading channel from .0025 to .01 that has contained the share price. One can see the shorter term declining tops line which has been in effect since April 2016. It was recently taken out with the last week's move into the .008s. The longer term resistance is the horizontal line at .01-.0109 which was established in Jan 2015 and is still in effect. Any material news, and GCEI could easily begin trading at levels not seen in over 3 years. GLTA


 (0)
(0) (0)
(0)