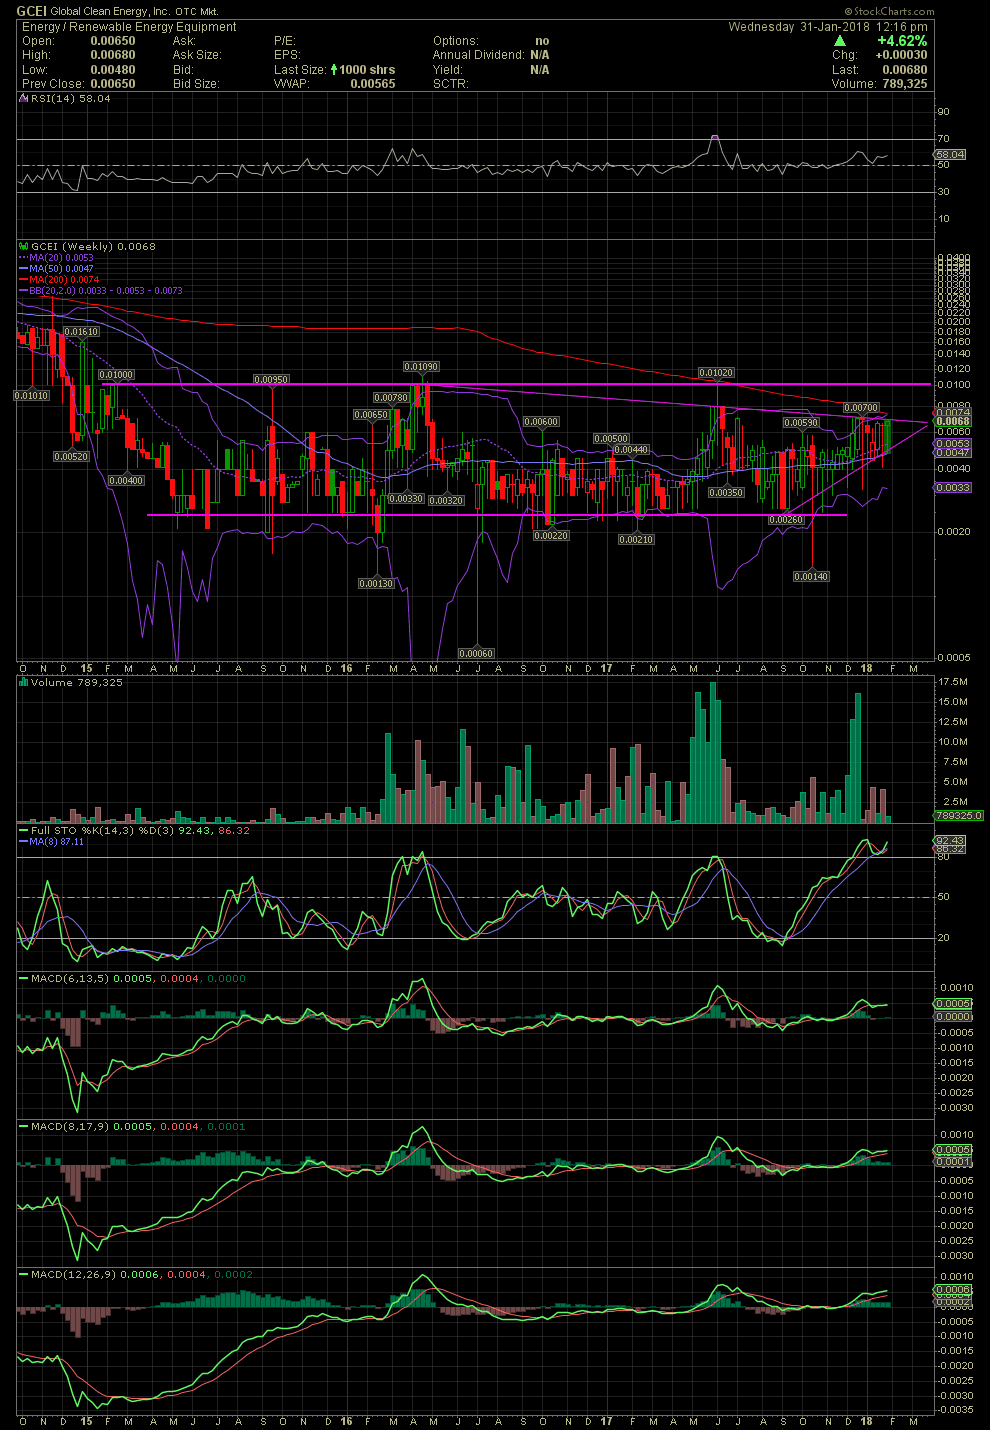
GCEI Weekly Chart ~ Getting Ready to Breakout to t
Post# of 2561

As management has worked to execute its business plan, the stock has trended over the last 3+ years between the .002s to .01. As one can see on the weekly chart below, the share price is approaching a potential break above the declining tops line. A break over the .007 level should bring into play a test of the multi-year horizontal resistance at .01. Any material news now would assist that move and breakout. GLTA

 (0)
(0) (0)
(0)