$TNTY ~ After Weeks of Declines After the Technica
Post# of 2561

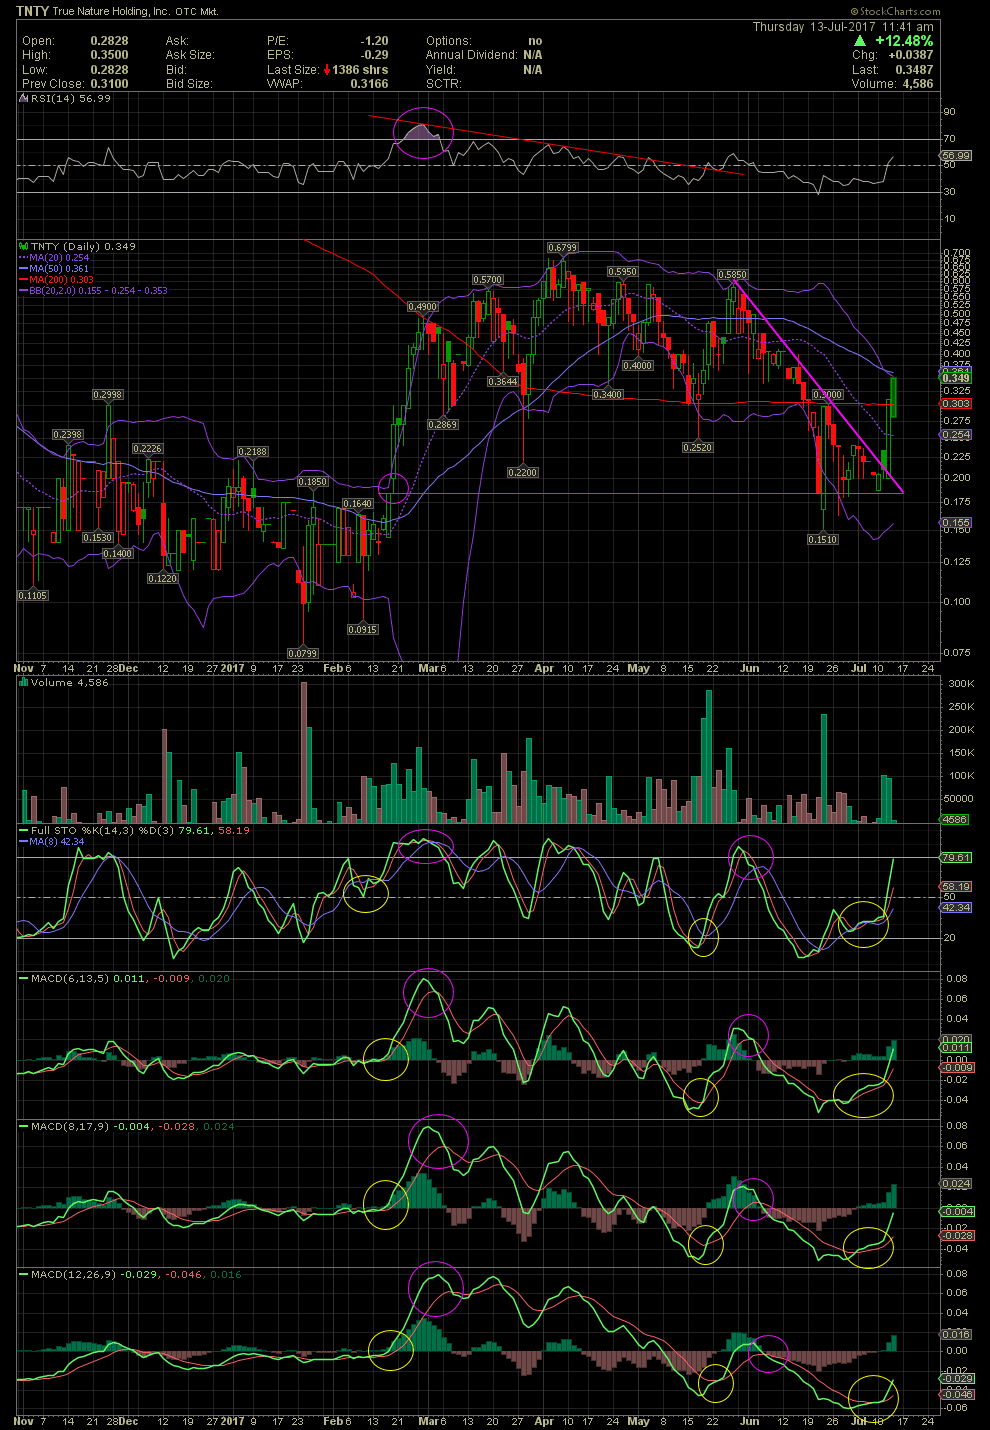
After TNTY's chart and technicals became overbought in April into late May, the stock began to sell off from as high at .67s to a low of .151 in mid June. This week saw the price breakout over the declining tops line which began in late May. The stock has recaptured the MA20 and 200 with the MA50 immediately ahead. Any fundamental news in the next few days should technically take the stock a new 52 week high. Stay tuned.

 (0)
(0) (0)
(0)