MPIX Daily Chart......... Getting Ready for a Good
Post# of 5570

MPIX Daily Chart......... Getting Ready for a Good Time Ahead
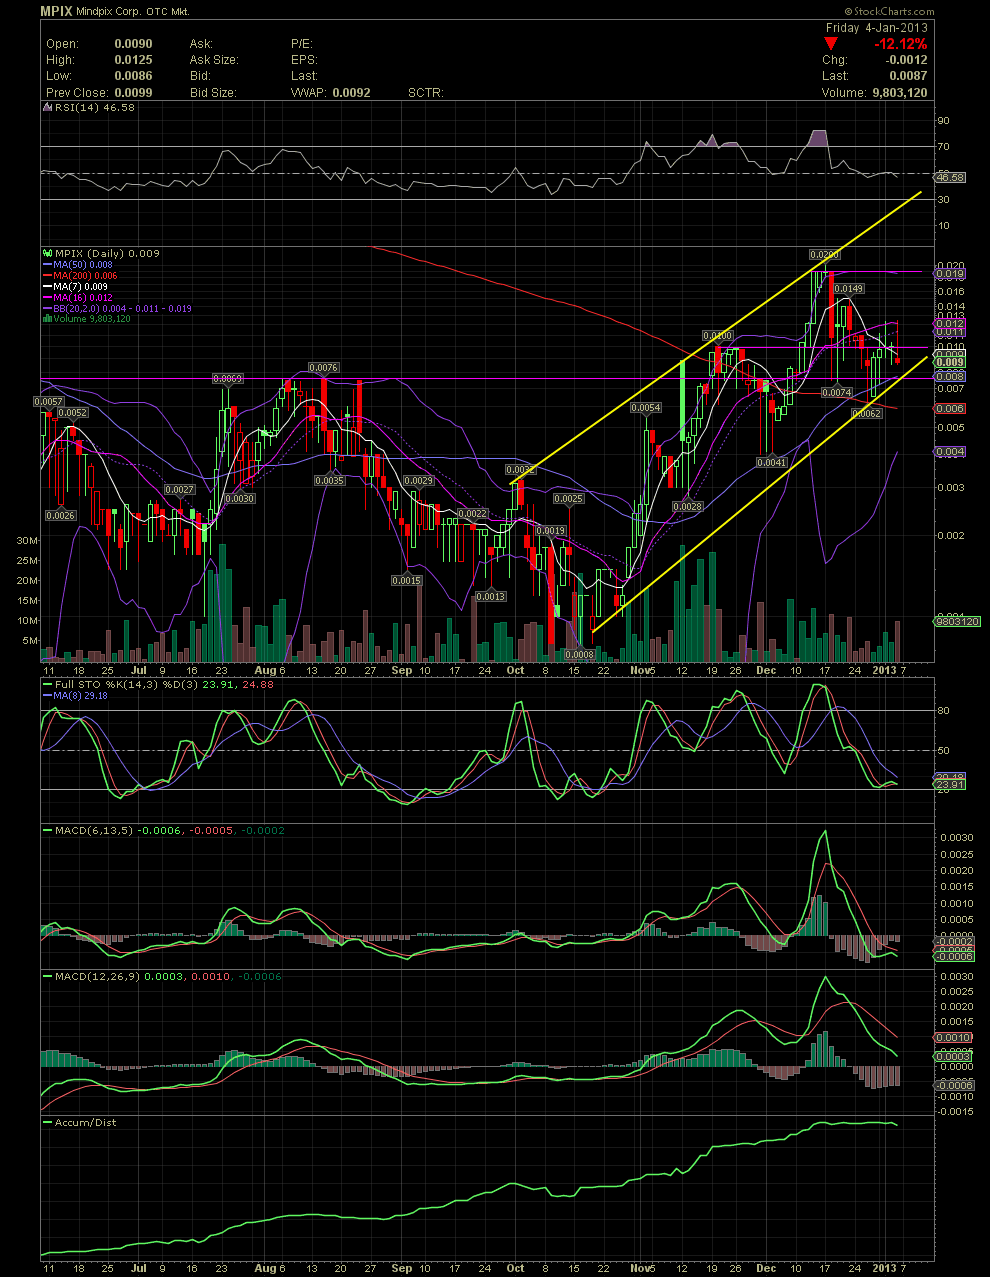
Interesting trading and close yesterday. While the stock was sitting at .0097 with a few minutes to go, three friends of mine entered buy orders at the ask amounting to just under 300,000 shares. Strange trading, as their orders weren't executed but a sizable sell order with 80 seconds to go was executed at .0087, the bid at the time. So instead of a Friday closing down .0002, MPIX closed at .0087, down .0012 for the day or 4.4% for the week. Had just one of those non-executed buy orders been filled, the charts would have looked a little different and actually given a few buy signals for those technical traders that might be following along. Still, not a bad thing for another week of consolidation after the big drop of two weeks ago. As you all know, if you've been following on, the stock was very overbought in mid December after it's run from .0041 to .02 in just two weeks. Some took profits and moved on, others sold a few and are reloading, while most I speak with have held every share and actually accumulated millions more during the pullback and churning. Whether the stock churns another day or more, who knows. But the more weak/impatient hands that sell into longer term hands, the better and stronger the next leg up.
Starting with the FullSto, please note the levels of the previous reversals to the upside. They all began near the 20 line. That indicator is very close to those previous levels. The faster MACD was actually reading to cross to the upside yesterday just prior to the last bidwhack of the week. The slower MACD has a little work to do although it was close to curling back up for the first time in almost three weeks. As to the moving averages, there were two attempts three attempts to recapture the MA7 and two at the MA16. As mentioned previously, it will get interesting once MPIX closes at .012/.0121. That would put the stock price over the 7, 10, 16 and the heavily followed MA20 (middle bollie), which is at .011. My guess is that might occur as early as mid week based on the trading history in MPIX since mid October. Moving to the longer term indicators of the RSI and A/D, the RSI is near the 50 line which the chart has reflected since late October. Obviously it is no longer in the extremely overbought levels of mid December. Also of interest is the A/D line. The flatlining simply represents the churning and backfilling of the share price since the top of .019/.02. Although losing as much as 65% from the high of .02 to the low of .0062, shares are being accumulated. Corporate news of any material items would send the stock well over .02 and up towards my next targets of .056 and .0885 imo.
You all have a great weekend! GLTA

 (0)
(0) (0)
(0)