GCEI ~ Chart and Technicals Resetting After the Mo
Post# of 2561

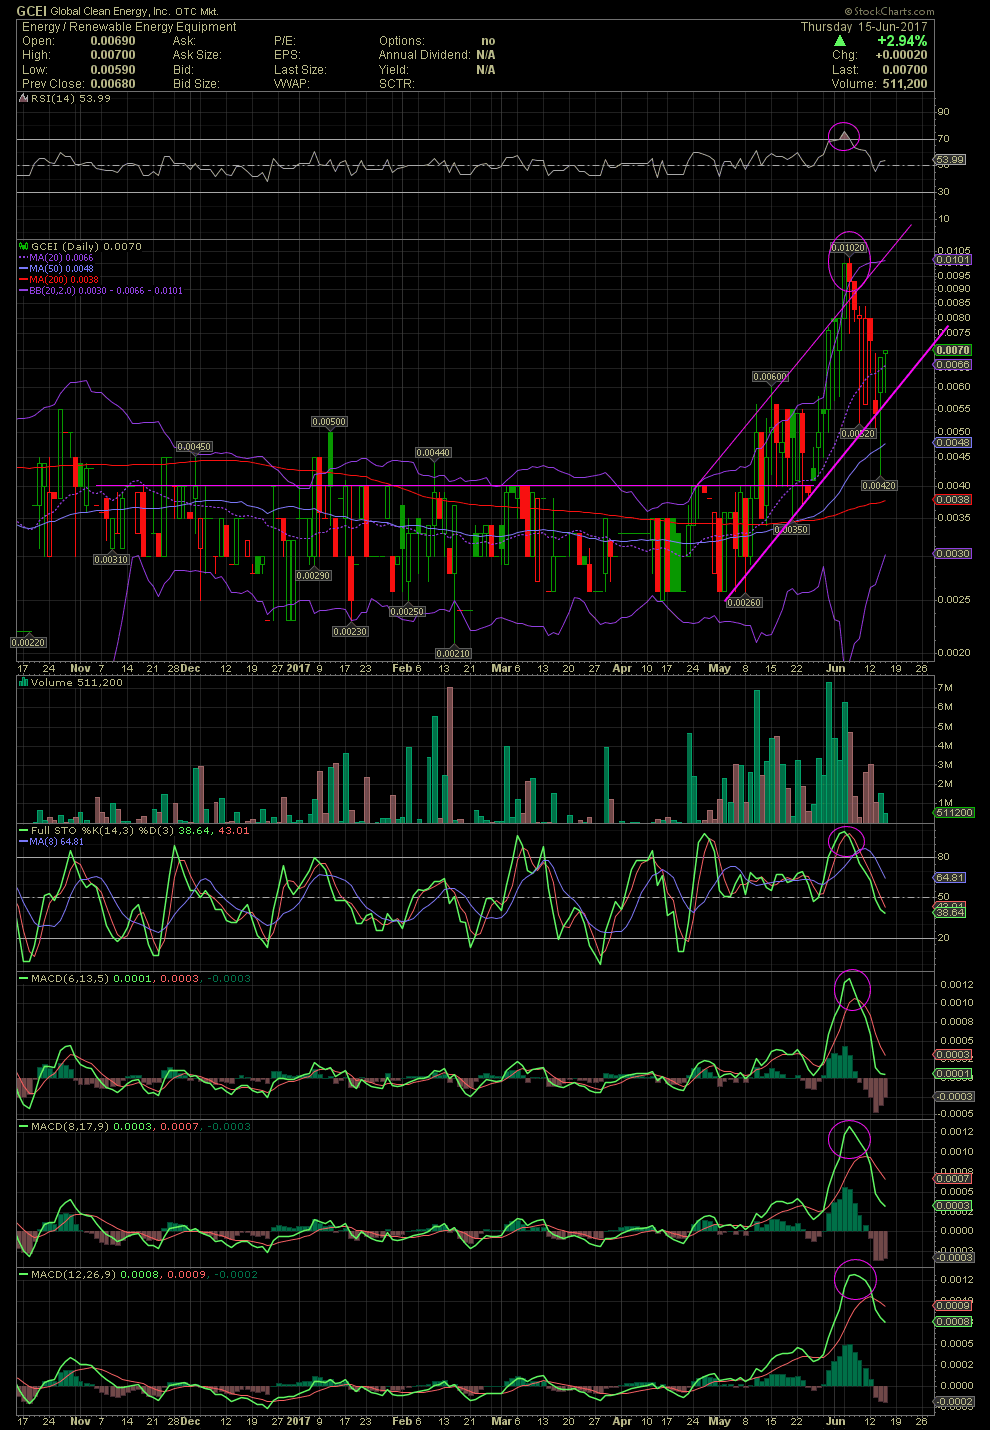
We've been accumulating GCEI for a few weeks now. The chart below shows shows the rising trading channel. After sideways trending from the .002s to ,004s, the stock began to breakout over the horizontal resistance line in May. Since then the stock has risen to as high as .0102 in anticipation of news. As one can see, the technicals were overbought last week with the RSI in the lower levels of the nose bleed zone, the FullSto and MACDs also in very high levels, while two candles were outside the upper bollie bands. The profit taking saw an intraday move on Wednesday to the horizontal support line of .004 while closing on the rising channel line. Although the technicals aren't quite there yet, news will always trump technicals. Chatter has it that the company will begin releasing news as early as mid week. So for those looking to enter, better down here than last week when the technicals were too overbought at the .01 level. GLTA

 (0)
(0) (0)
(0)