Bullish Hammer: Interpreting Japanese candlestick
Post# of 109715
(Total Views: 386)
Posted On: 05/24/2017 9:29:42 AM

Re: billyboombatz #13793
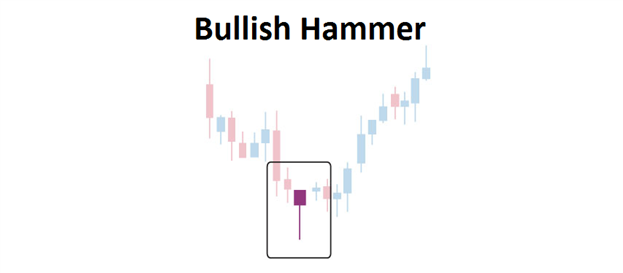
Bullish Hammer:
Interpreting Japanese candlesticks can give a trader important insight into market momentum. By understanding how to read candles, traders can often include them in their analysis to find areas of price continuations and possible reversals. Today we will focus on one candle that can help validate a charts reversal point. Let’s learn to identify and trade the bullish hammer candle.
What is a bullish hammer?
A bullish hammer differs from other candle patterns as it is a single candle hinting at a turn during an established downtrend. Pictured above the hammer is interpreted by understanding a candles particular open, low high and close levels. To create a hammer price must first significantly sell off to create a new low for a currency pair. However, after this decline, prices must significantly rally causing prices to have a small body and close near its opening price. It should be noted that hammers should have long wicks at least twice the length of the candle body. As well, the candle itself can either be red or blue depending on the strength of the reversal.
Often the bullish hammer is confused with a bearish hanging man candle. The misrepresentation is logical because both candles look identical! The difference between these two candles lies in their placement in a trending market. The hanging man has a small body and lock wick but is found hanging at the conclusion of an uptrend. Bullish hammers have small bodies and long wicks also, but are only seen at the end of a downtrend.
 (0)
(0) (0)
(0)
Sojourner here following God, obeying God, and cleaving to Him. The journey is onward.