CTIX Daily Chart Good Evening everyone. I was
Post# of 72451

CTIX Daily Chart
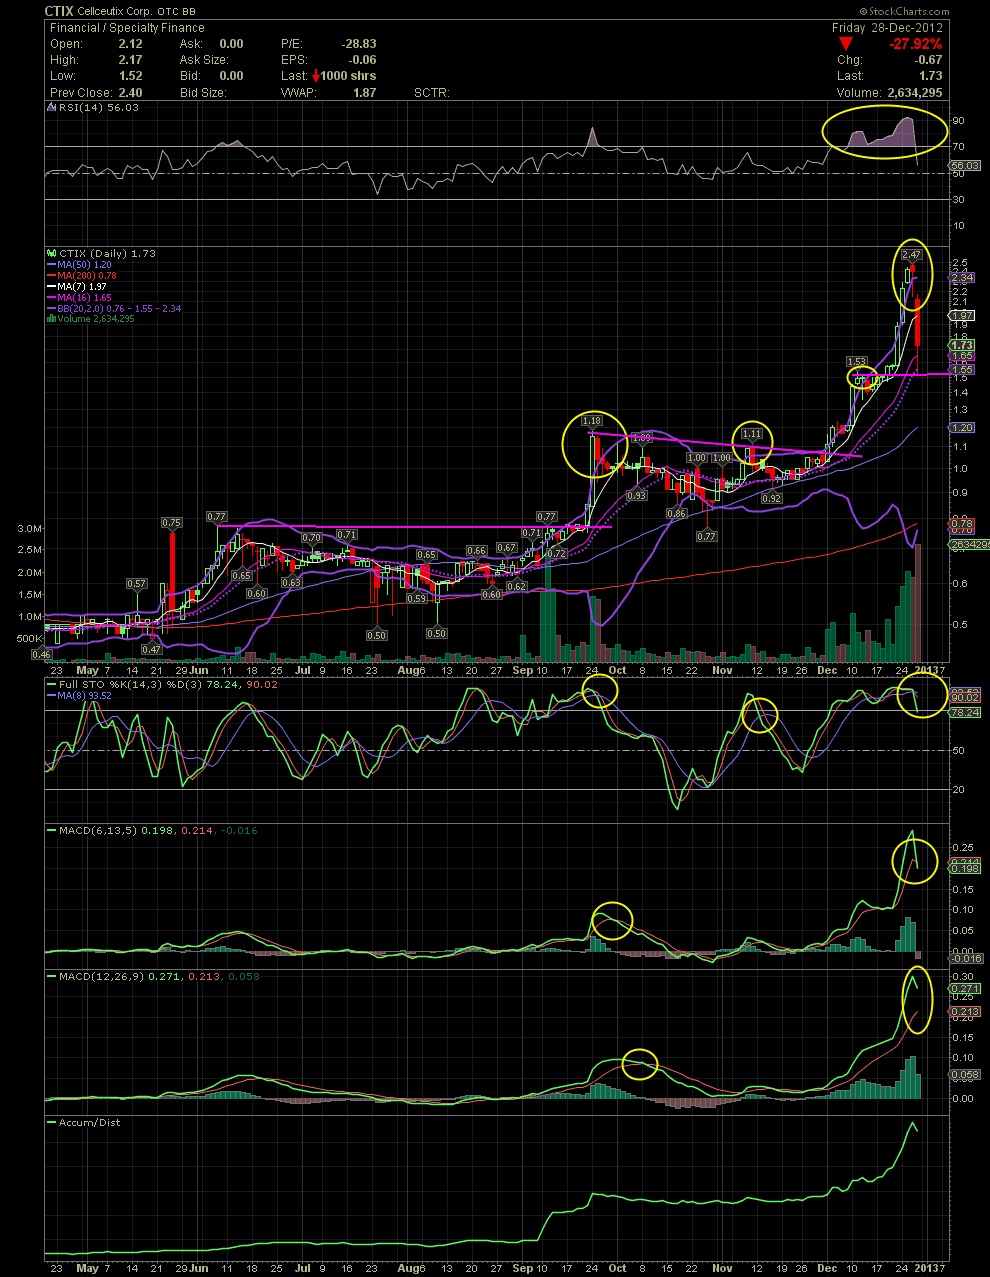
Good Evening everyone. I was asked to drop off a chart with a few comments. Link back to my previous charts on this board with the discussions of the overbought conditions with the indicators that I have on previous charts. No need to go into any details because I understand that most don't put much faith or importance into charts. But they are great tools to compliment one's DD. I've simply circled the indicators and areas what I watch for as caution or danger signs. As few of us here have touched on the violations of the upper bollie band. As you can all see, looking at the trading of last week, the first candle outside the upper bollie occurred on Wednesday. The entire candle was outside. The candle of Thursday was also outside the upper bollie on the opening of the trading day. A selloff happened but the bulls were able to recover most of the decline. The problem was, as a couple of you noticed, that the Thursday close was still outside the upper bollie. One also will never know how a stock returns to within the bollies. It could simple retreat gradually, as was the case back in late Sept. It could move sideways allowing the bollies to move up and over the share price as in early December. Or, unfortunately, the stock price can collapse as we saw Friday. Add to the equation the extremely overbought conditions of other indicators. The RSI that was well above 90, 70 becomes a caution sign to me. The MACDs were also very overbought and the FullSto had already gone to a sell signal on Thursday morning. I circled a few areas in yellow prior to the correction. The problem is, although the chart showed some imminent danger, one doesn't know when a reversal might occur. But it does offer plenty of warnings, and those overbought conditions were in plain view prior to the drop.
Now the job for a technician is to find a point what might serve as a calculated opportunity to add or re-enter as closely as possible to a reversal to the upside. Once the MA7 and 10 were breached, the next possible support became the MA16 and 20. Another area to look for is any previous horizontal resistance, which in the case of CTIX was the 1.50/1.53 level. That line (in pink) was drawn on my chart over two weeks ago (link back for a review). An intraday bounce of the horizontal support and the MA20 shouldn't have surprised anyone. Those of you that were able to snag a few in the 1.50s did well, for now anyway. The question is, will this prove out to be the bottom? No one knows. All one can look for is the next possible support levels should the current support levels be taken out. That could be the MA50 or the 1.00 level. No doubt, there's work to be done before a technical buy signal can be seen again. It's been a great run but no stock ever goes straight up.

 (0)
(0) (0)
(0)