
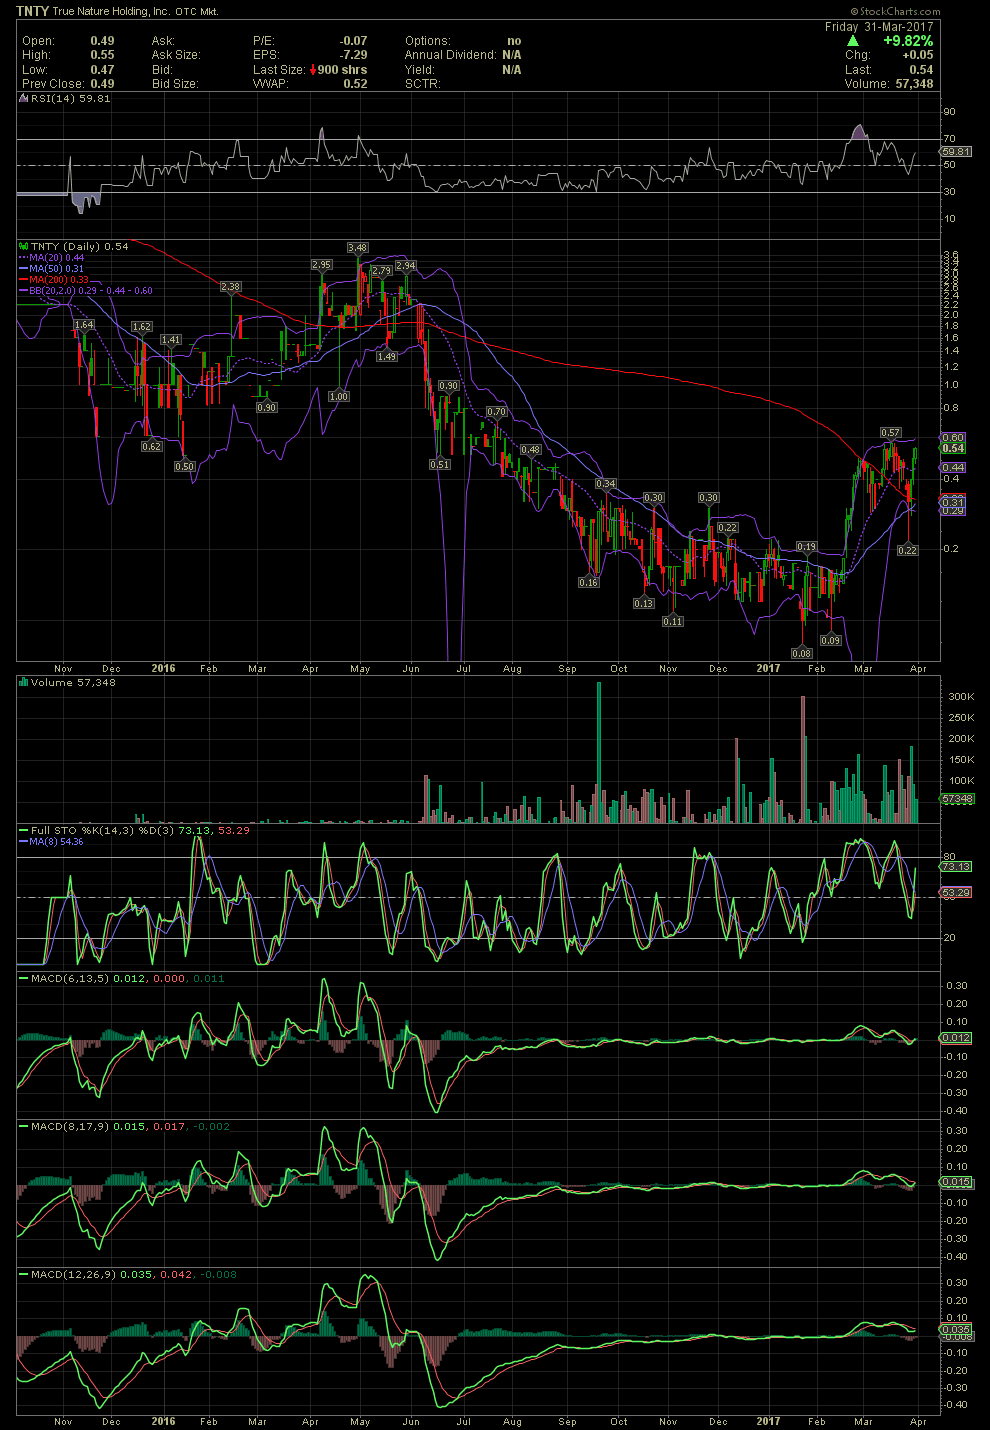
TNTY Daily Chart ~ Up from .08/.09 in Late Jan/Early Feb to .50s
TNTY has now appreciated from sub .10 in early February to as high at .57. Immediately after its first run to .49, the stock corrected to the MA20 just below .30 in early March. A second move higher took the stock to .57 just before the next decline, last Tuesday, which saw one trade below .30, and it was for 53K shares at .22. It was very suspect, as numerous bids in at the time were bypassed for the print of that one transaction. Wednesday thru Friday saw a sharp move right back to the levels prior to the latest correction. Interestingly enough, had that one trade at .22 not occurred, one could make a case that the stock pulled back to the lower bollie, the MA50 and the MA200. Either way, the stock did not close below the MA50, and the subsequent rally took the stock back over all moving averages, the 20, 50 and 200. For those that look for another longer term event to confirm the strength of the underlying stock, a Golden Cross (MA50 crossing over the MA200) will occur no later than Tuesday. Additionally, the declining tops line of the RSI was just broken above on Friday. The FullSto and MACDs also saw reversals from their overbought conditions an beginning to execute positive crossovers as they curl back to the upside.
The second chart below, shows a look at an 18 month timeline. Should the stock break above its recent high of .57, I don't see much in the way for a move back to at least .90 and possibly an easy technical move towards the $1.50-$2.00 levels, not seen since June 2016. That was when a failed acquisition began to unravel. GLTA