TNTY Daily Chart ~ A Correction After Running Into
Post# of 2561

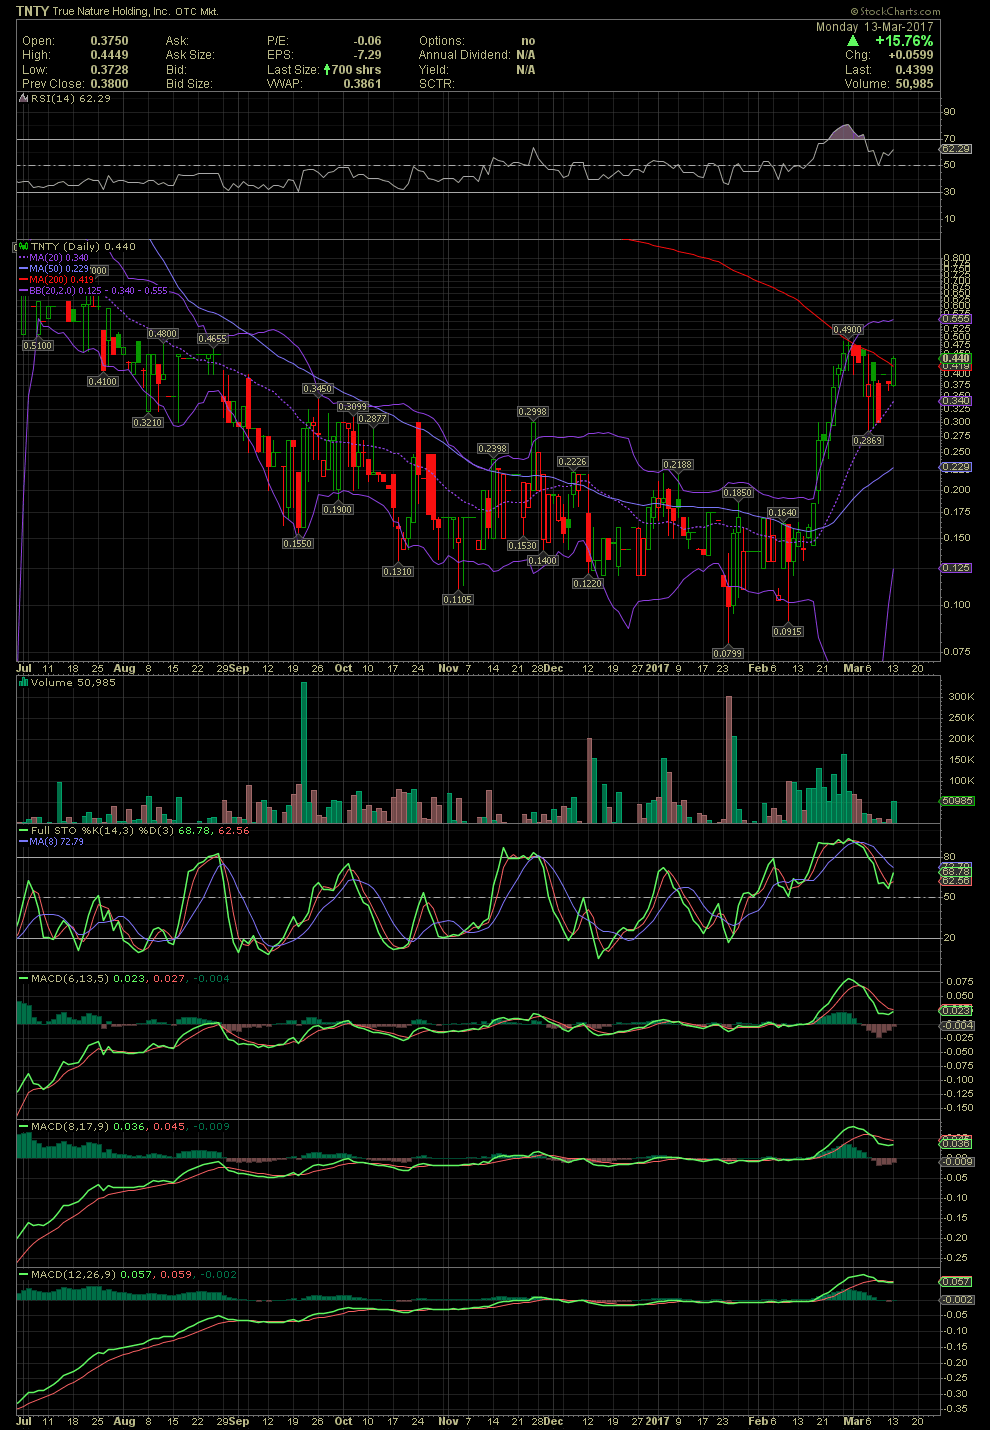
Two charts below for those following along with TNTY. As one can see on the shorter term chart, the stock rallied from the .08s/.09s a few weeks back to as high as .49. After breaking over the MA20 and MA50, TNTY ran into the MA200 at that .49 level. The stock corrected and held the MA20 just under .30 last week. The expected bounce off the MA20 led to today's close above the declining MA200 with some nice volume versus the decreasing volume of last week. All indicators have reset from their slightly overbought conditions and the stock appears ready to begin its next leg up.
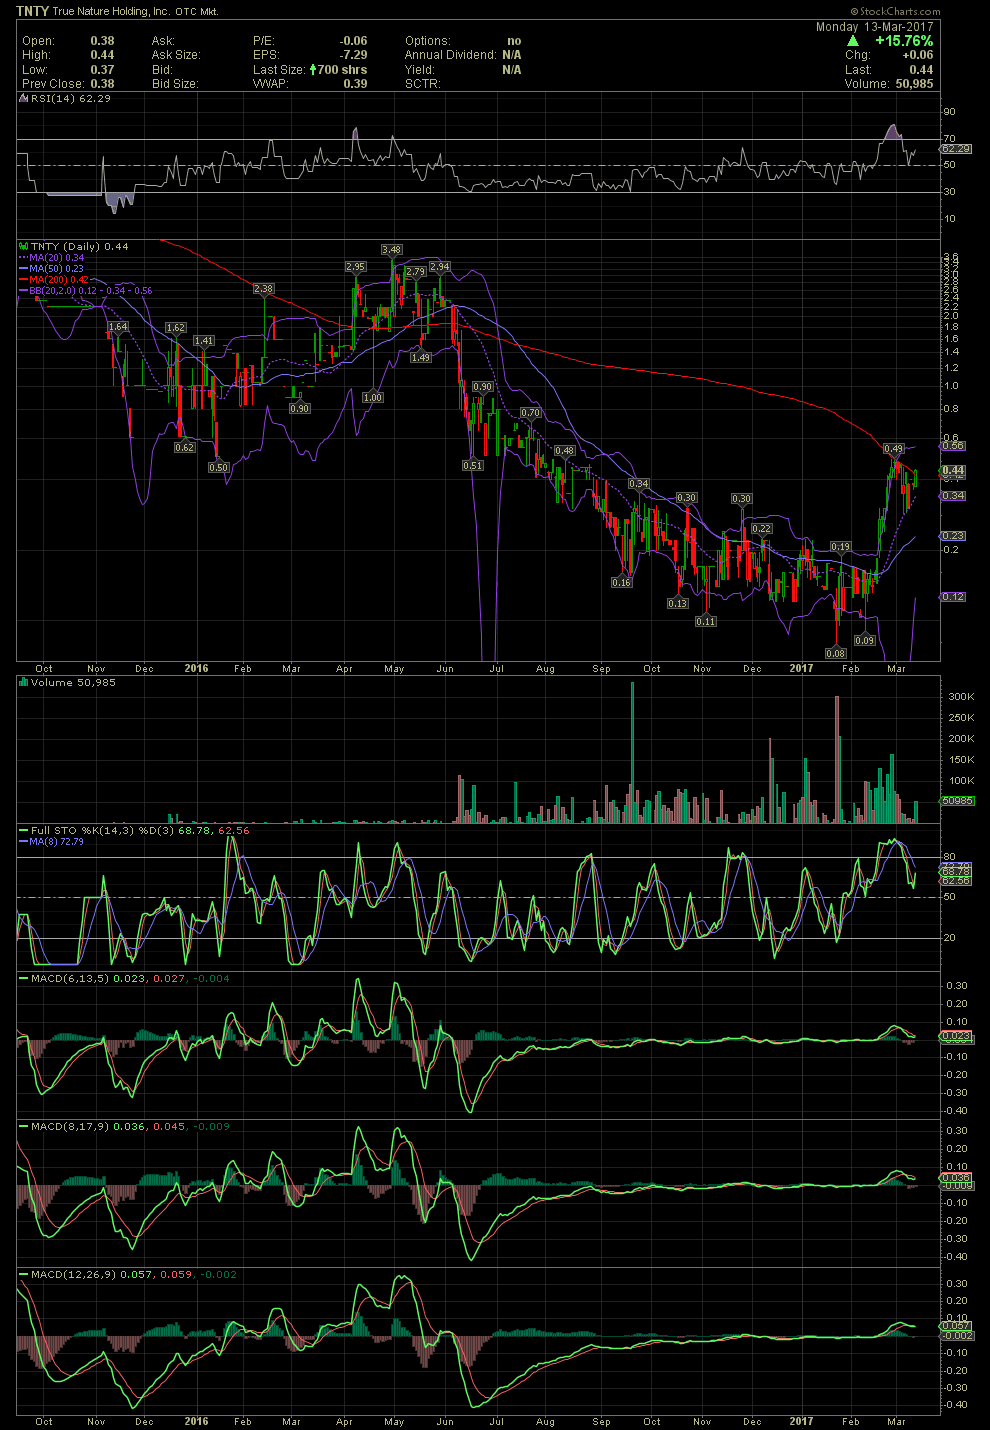
On the second chart, a longer term look at things, one can better see where the next technical resistance points may be. Since the decline, during the second half of 2016 was fairly steady without any consolidation of weeks at any specific levels, the stock could see a fairly steady move back up to the levels of 1.00+.
Three very solid management and board positions were announced while more are expected shortly. The existing LOI of an acquisition also looks good for the gradual transition from a startup to a growth phase for TNTY. Link to the previous filings and releases for some DD or visit their website. GLTA


 (0)
(0) (0)
(0)