MPIX Daily Chart......... Higher Lows Since the Tu
Post# of 5570

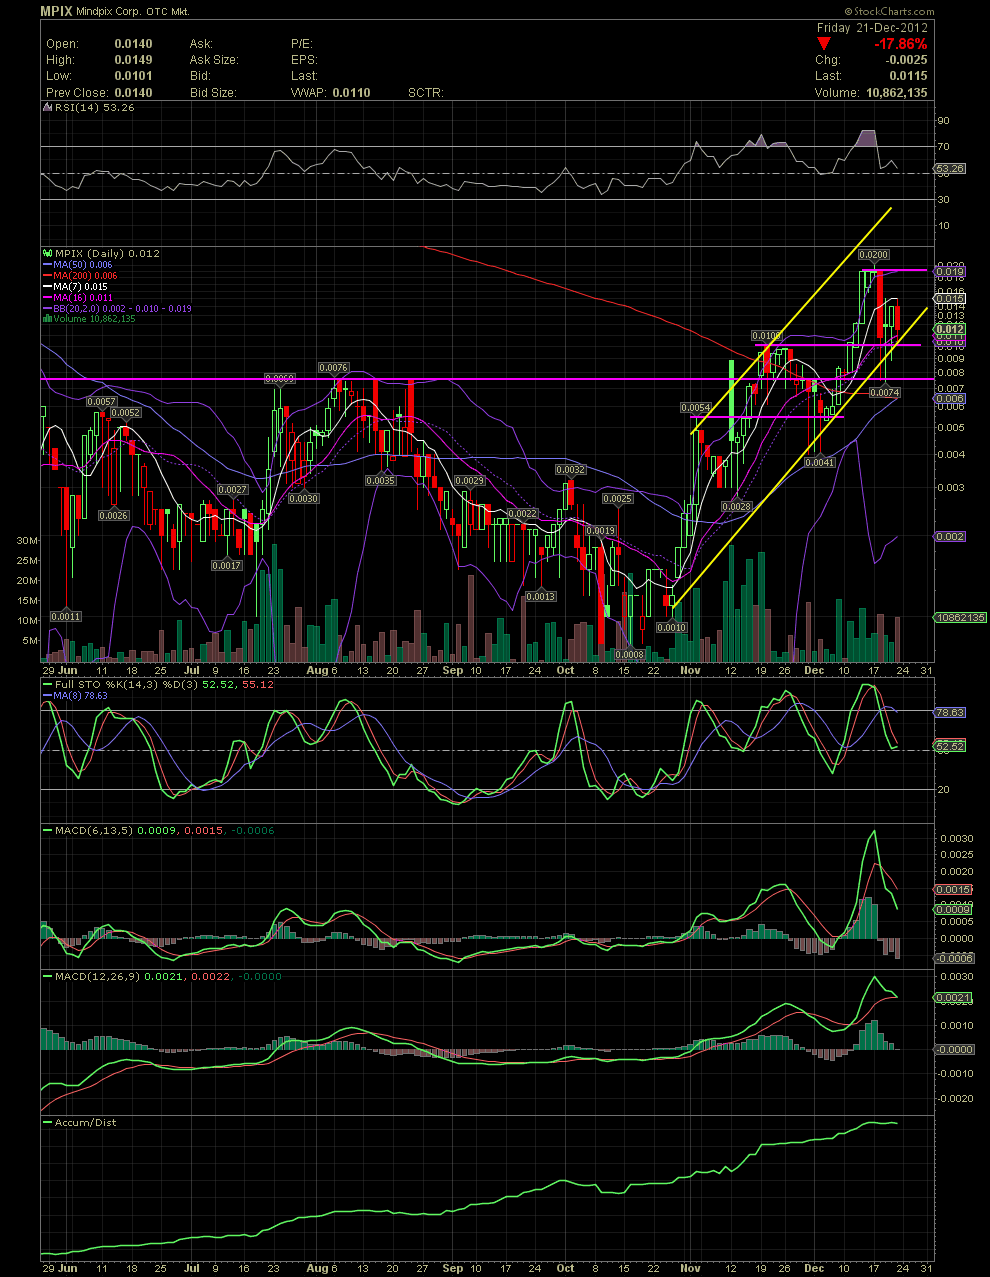
MPIX Daily Chart......... Higher Lows Since the Tuesday Selloff
The third day of consolidation behind us after the Tuesday dive. The previous pullbacks and consolidations during this uptrend since mid October have taken from 4 to 6 days. Maybe another 1 to 3 days before a renewed leg up? Who knows, but what for the indicators to continue resetting. Of interest to me is the continued accumulation during all selloffs. Someone has been gradually buying since last June. A break above .02 with volume, will probably see us test that .056 and .0885 that I've been pointing out on the 18 Month Daily and the Weekly Charts. Looks like we have a lot more in store for us. GLTA

 (0)
(0) (0)
(0)