Investors Hangout Stock Message Boards Logo
  • Mailbox
  • Favorites
  • Boards
    • The Hangout
    • NASDAQ
    • NYSE
    • OTC Markets
    • All Boards
  • Whats Hot!
    • Recent Activity
    • Most Viewed Boards
    • Most Viewed Posts
    • Most Posted
    • Most Followed
    • Top Boards
    • Newest Boards
    • Newest Members
  • Blog
    • Recent Blog Posts
    • Recently Updated
    • News
    • Stocks
    • Crypto
    • Investing
    • Business
    • Markets
    • Economy
    • Real Estate
    • Personal Finance
  • Market Movers
  • Interactive Charts
  • Login - Join Now FREE!
  1. Home ›
  2. Stock Message Boards ›
  3. Stock Boards ›
  4. Mindpix Corporation (MPIX) Message Board

MPIX Daily Chart.......... Day 2 of the Current Co

Message Board Public Reply | Private Reply | Keep | Replies (2)                   Post New Msg
Edit Msg () | Previous | Next


Post# of 5570
Posted On: 12/19/2012 8:00:21 PM
Avatar
Posted By: Big Tuna

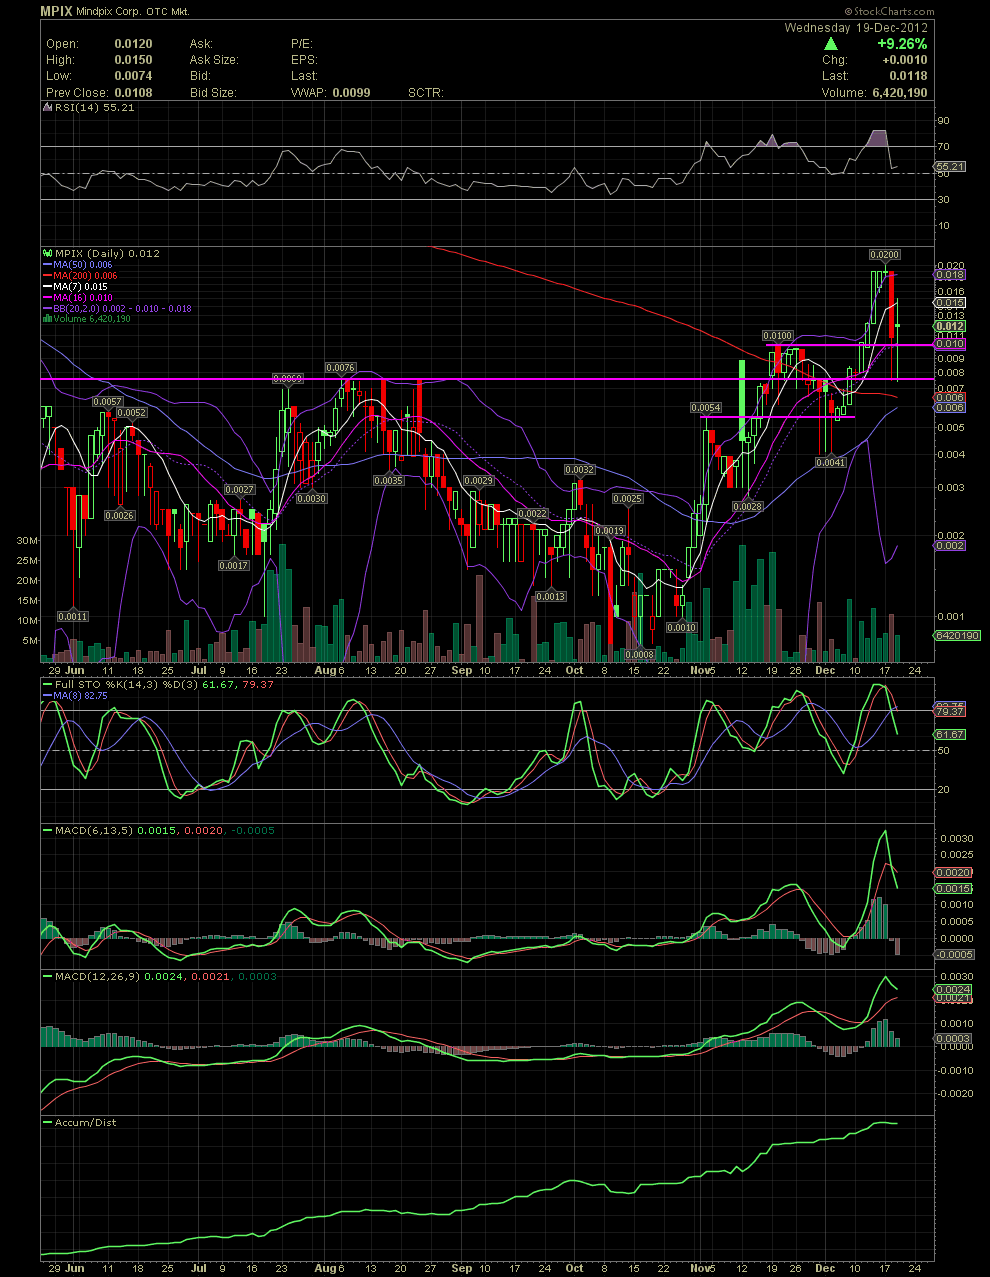
MPIX Daily Chart.......... Day 2 of the Current Correction


A quick look at the chart shows day #2 of get correction. Pretty much a repeat of last night's update. MPIX's pullbacks over the last couple of months, have lasted from 4 to 6 days. The long tails of the candles yesterday and today show the intraday lows and the subsequent rallies off those lows. Today was a day minor tug of war between the sellers and the longs. The stock ended up 9.26% for the day although just below the opening price. My guess would be a bit more consolidation to go unless some strong news is released that would bring in some strong buying.


Two days ago, the RSI, as well as all the other indicators on this chart, were very overbought. The RSI held the 50 line today, as it did during the early December pullback. The FullSto and faster MACD are rapidly falling from their overbought conditions. I would like to see the FullSto hold just above its 50 line. And the longer term MACD is also correcting but since it's a slower setting that the other MACD, the correction there isn't as pronounced. As with yesterday's trading, the intraday low for the day was just under the .0076 support zone. The close of .0118 was just over the support line of .01 while also closing above the MA 16 and 20. For those that like the Golden Cross event, you will see that occur in another two days. I believe I made mention of it about two weeks ago. I said it would probably take a couple of weeks. I don't use the G.C. for anything as it's waaaaaay to slow. By the time the MA50 crosses the MA200, a lot of lost profit is normally missed. On the Big Boards, I do use it as a longer term trend indicator. Resistance points on the way back up on the daily would continue to me the MA7 sitting at .015. Oh! The high of the day today was .015. Go figure. Once the stock price gets thru .015, the .019/.02 top will be the next resistance to get thru. GLTA


(0)
(0)


Mindpix Corporation (MPIX) Stock Research Links


  1.  
  2.  


  3.  
  4.  
  5.  


Investors Hangout

Home

Mailbox

Message Boards

Favorites

Whats Hot

Blog

Settings

Privacy Policy

Terms and Conditions

Disclaimer

Contact Us

Whats Hot

Recent Activity

Most Viewed Boards

Most Viewed Posts

Most Posted Boards

Most Followed

Top Boards

Newest Boards

Newest Members

Investors Hangout Message Boards

Welcome To Investors Hangout

Stock Message Boards

American Stock Exchange (AMEX)

NASDAQ Stock Exchange (NASDAQ)

New York Stock Exchange (NYSE)

Penny Stocks - (OTC)

User Boards

The Hangout

Private

Global Markets

Australian Securities Exchange (ASX)

Euronext Amsterdam (AMS)

Euronext Brussels (BRU)

Euronext Lisbon (LIS)

Euronext Paris (PAR)

Foreign Exchange (FOREX)

Hong Kong Stock Exchange (HKEX)

London Stock Exchange (LSE)

Milan Stock Exchange (MLSE)

New Zealand Exchange (NZX)

Singapore Stock Exchange (SGX)

Toronto Stock Exchange (TSX)

Contact Investors Hangout

Email Us

Follow Investors Hangout

Twitter

YouTube

Facebook

Market Data powered by QuoteMedia. Copyright © 2025. Data delayed 15 minutes unless otherwise indicated (view delay times for all exchanges).
Analyst Ratings & Earnings by Zacks. RT=Real-Time, EOD=End of Day, PD=Previous Day. Terms of Use.

© 2025 Copyright Investors Hangout, LLC All Rights Reserved.

Privacy Policy |Do Not Sell My Information | Terms & Conditions | Disclaimer | Help | Contact Us