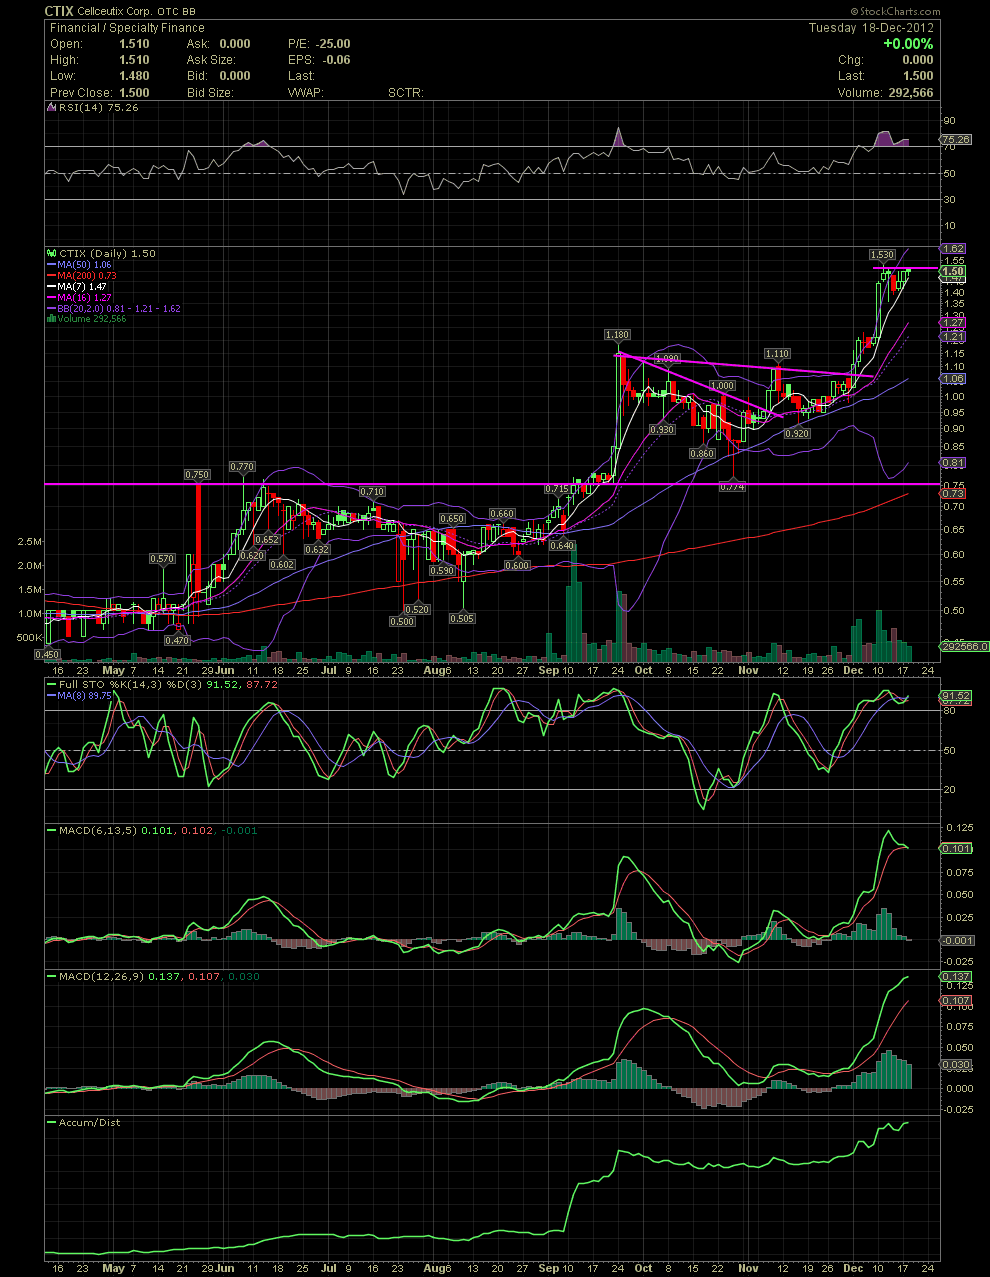
CTIX Daily Chart......... A few days of consolidat
Post# of 72451
CTIX Daily Chart......... A few days of consolidation is a good thing
Good Morning Big Jeff and CTIXers! We had a nice run early last week, but rather than selling off, as was the case with the previous two moves in late Sept and early Nov, the sellers have been absorbed during a week long sideways consolidation. Either way, when the share price moves too far outside the upper bollie, as I've mentioned here before, the candles will always return inside the bollie channels. The same is the case when a stock drops too far outside the lower bollie as you can see on various trading days in late July, early August and late October. Over the three days, the stock has been holding the MA7 and started to inch its way up from the 1.40 level. The various indicators that I use are still a bit overbought, such as the FullSto, MACDs and RSI. Baring news, it wouldn't surprise me to see a bit more consolidation as the overbought conditions reset. Thanks again to those of you who first shared CTIX with me when you joined the Hangout. The stock was in the high .70s/low .80s. You can see the pink resistance points and how a good stock will normally breakout above those points. Those points are usually good spots to chose when looking to enter a stock or add to ones position. And like always, once a stock moves sharply higher, everyone, including me always wished we had purchased more, lol. Adding a few here and there during the minor corrections is what I did. GLTA

 (0)
(0) (0)
(0)