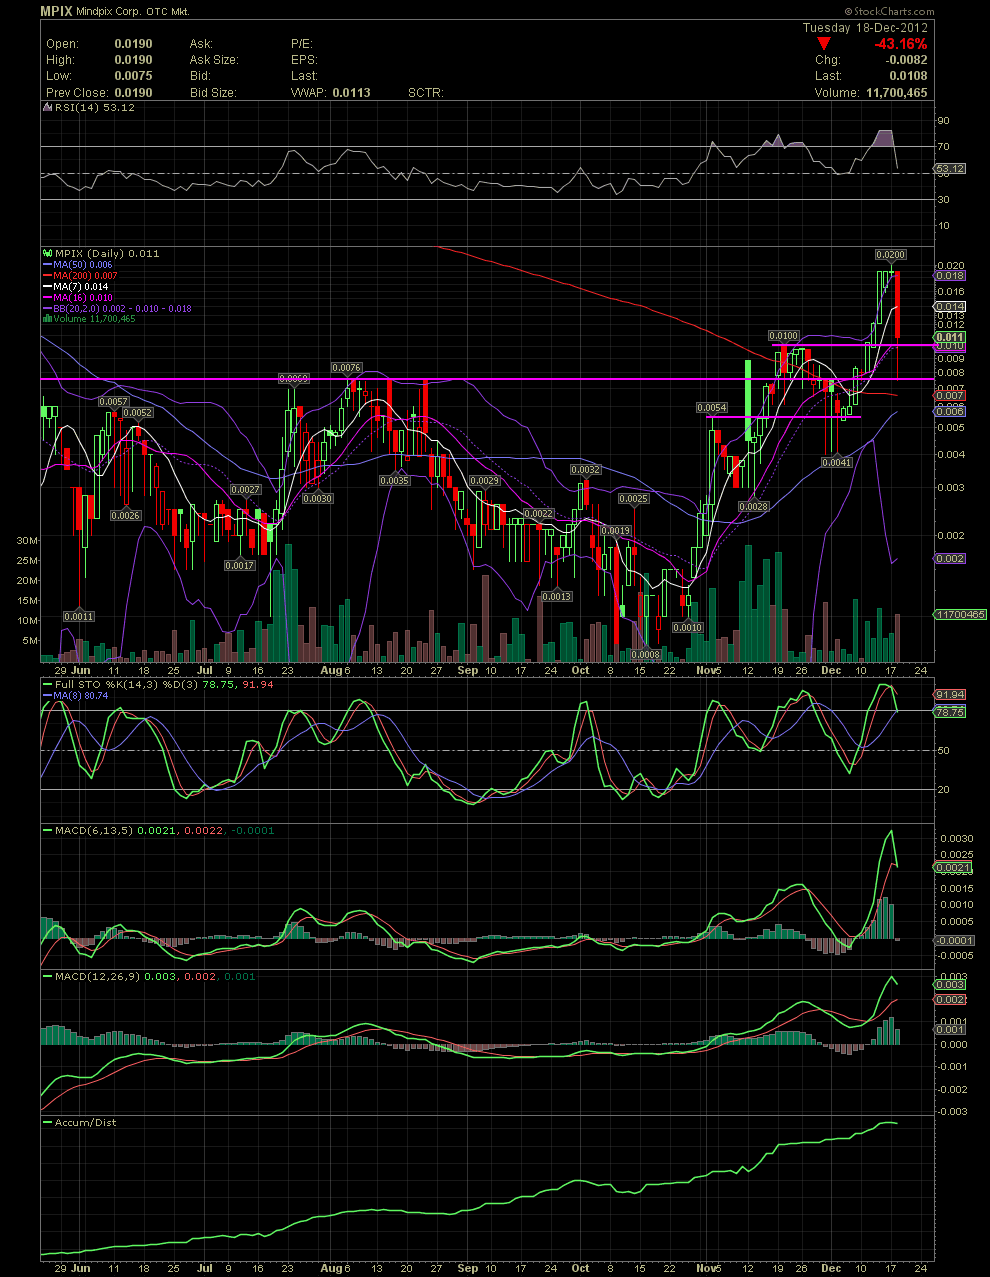
MPIX Daily Chart........ A Tough Day, For Sure
Post# of 5570

MPIX Daily Chart........ A Tough Day, For Sure
A bad day for the longs but the story is just beginning for MPIX imo. Sucks to see our value down 50%, but that's the penny arena. It seemed obvious at the opening, the the stock was going to take a hit today. L2 was showing .0027 x .019 at the opening bell. No one bidding and very few buys at the ask. So the sellers took over today during the first two hours of the trading day. I mentioned over the last couple of days that MPIX was overbought. I thought there would possibly be some consolidation or a pullback. I sure didn't expect a wipeout like today. When looking at the chart, it looks awful, no doubt. But here's my take fwiw. The decline of early Oct to mid Oct was 75% to a low of .0008. The stock recovered to a high of .0054 in late Oct. During the next week, the stock corrected almost 50% to a low of .0028. The stock reversed in mid Nov and ran to .01 within two weeks. Yet another correction to .0041 or a decline of almost 60%. And yet the stock recovered again rallying from .0041 hitting a high of .02 yesterday. The drop today to an intraday low of .0075 from .019 was approx 60%. Might the stock reverse shortly to hit new highs?
As to the technicals, there are a few things of interest. Notice where it held intraday, both the intraday low and the close. The two horizontal support/resistance lines are lines that I've had there for a few weeks. The lowest of the three was the previous high of .0054. When that high was taken out, the stock topped at .01. When that high was taken out, the stock ran to .02. That high of .02 is now our new resistance. The intraday low today was .0075, close enough to the .0076 high of early Aug. That horizontal line (middle pink line) serves as a possible support line. Today it held. The upper horizontal line represents the high of .01 which was hit in mid Nov. The close today held above that point. The MA16 rests at .01 at the close. The middle bollie, also the MA20, also sits at .001. Obviously, all the remaining indicators are in decline, but it once again, as with previous corrections, allows the sellers out and for longs to either enter or continue accumulating more shares. Adding or entering at these potential support zones of the charts helps one to make a more calculated decision as to when to pull the trigger. So, does one poop their pants and move on? Or does one decided to hold or add? That's the question that the investor will have to answer for themselves. I know a few of us added nicely today. GLTA

 (0)
(0) (0)
(0)