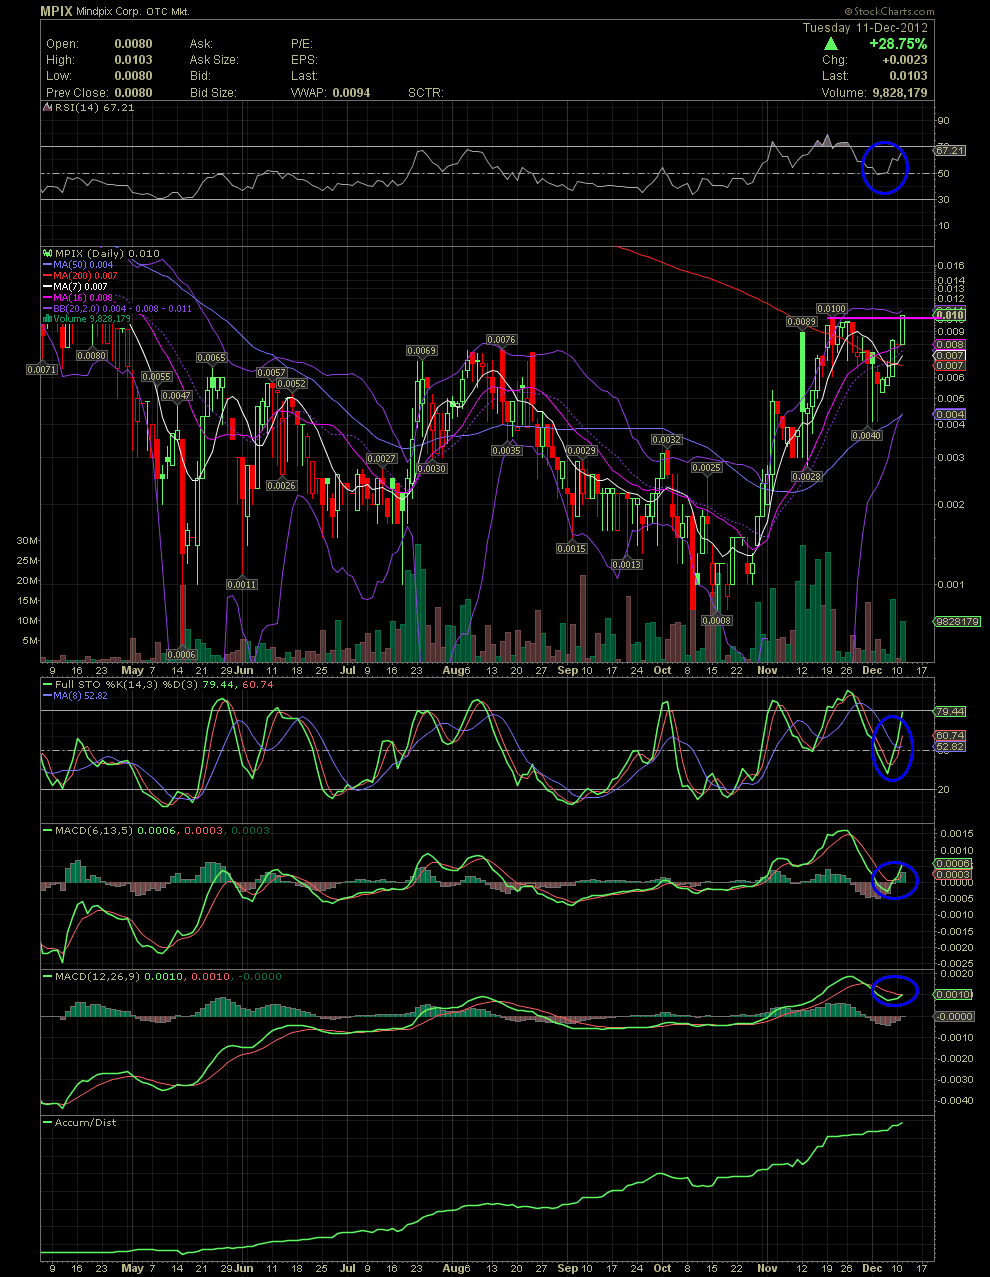
MPIX Daily Chart.... The Highest Close Since April
Post# of 5570
MPIX Daily Chart.... The Highest Close Since April for those not paying attention
As mentioned previously that all dips while I was gone should be looked at as opportunities to buy MPIX. Follow the money and the chart is your map. We've now moved above all the Moving Averages after an approx two week selloff. Today's close of .0103 is the highest share price and close since April. I'd like to see some follow through tomorrow to confirm the breakout of the previous top of .01. That top, though, was simply one trade at the opening of 5,000 shares at .01. Not much resistance to worry about, but it would be good to see some follow thru of today's 28.75% gain. As most anyone can see, the stock price was at .0008 just under two months ago. The move has been slow and steady with some nice pullbacks and consolidation along the way. Although it's not fun to witnes red days in ones account, this type of consolidation does allow for others to enter using the selling for some great entries. MPIX held above the MA50 three days in a row in late Nov/early Dec prior to the stock gaining momentum again for the next leg up. The upper bollie is also being to curl up again so that we could see another nice Upper Bollie Surfing event as we saw in November.
In short, pay attention to the charts and the fundamentals that are being announced. The chart is telling us that some big money has been accumulating for months now. GLTA

 (0)
(0) (0)
(0)