TNTY Daily Chart ~ From .155 to .30 So Far Plea
Post# of 2561
Posted On: 10/02/2016 12:30:21 PM

TNTY Daily Chart ~ From .155 to .30 So Far
Please link back to my TNTY on late Sept 28 (post, #2335) for a short explanation of the chart and my technical opinion:
http://investorshangout.com/post/view?id=4085111
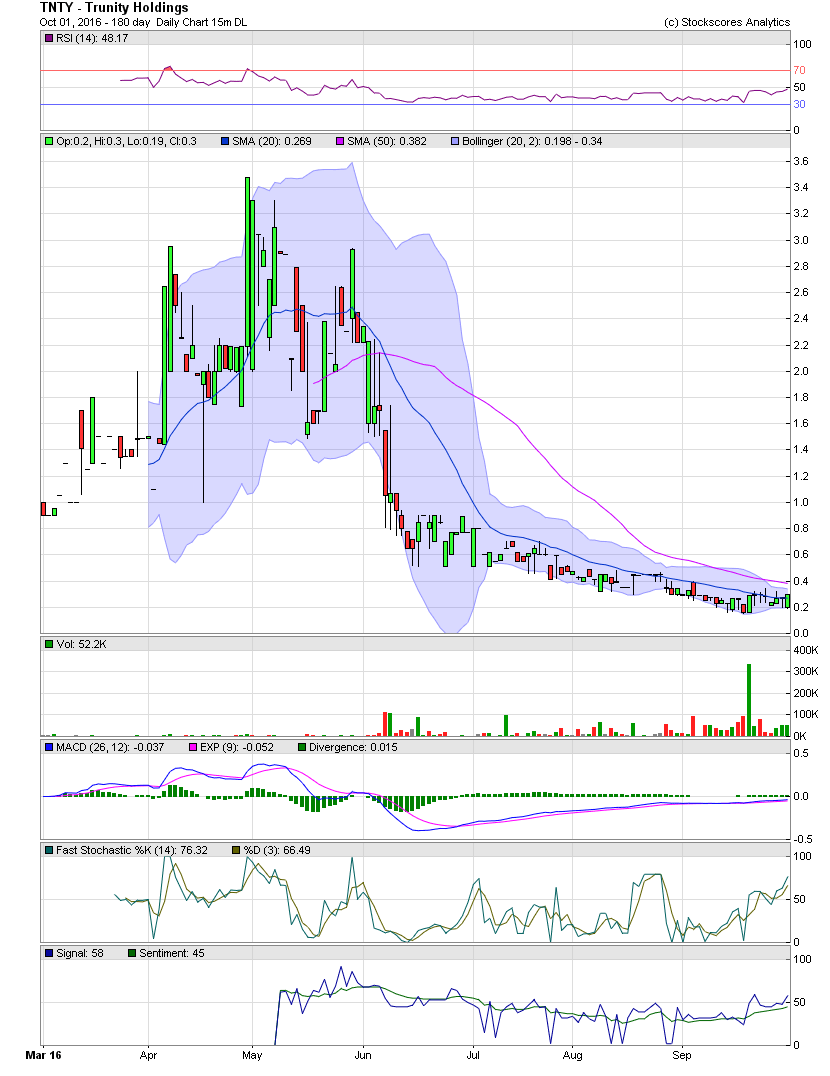
As mentioned in that post, I believed TNTY was getting ready to begin moving up and over its MA20, which hasn't been seen since May. On Friday, we saw the beginning of that move when the stock traded from an intraday low of .19 to close at .30. One can see on the charts below, the stock hasn't closed above its 20 day moving average since late May. The volume spike, that the stock saw approx two weeks ago, was a telling sign that investors saw value there and the low was probably seen. The stock hit an intraday low of .155 and has now doubled in price. As you can also see, the RSI has risen to almost 50 after months of trending near 30, and the MACD is getting ready for a move over its zero line. A Shareholder Update was released Friday. TNTY has some legs imo.
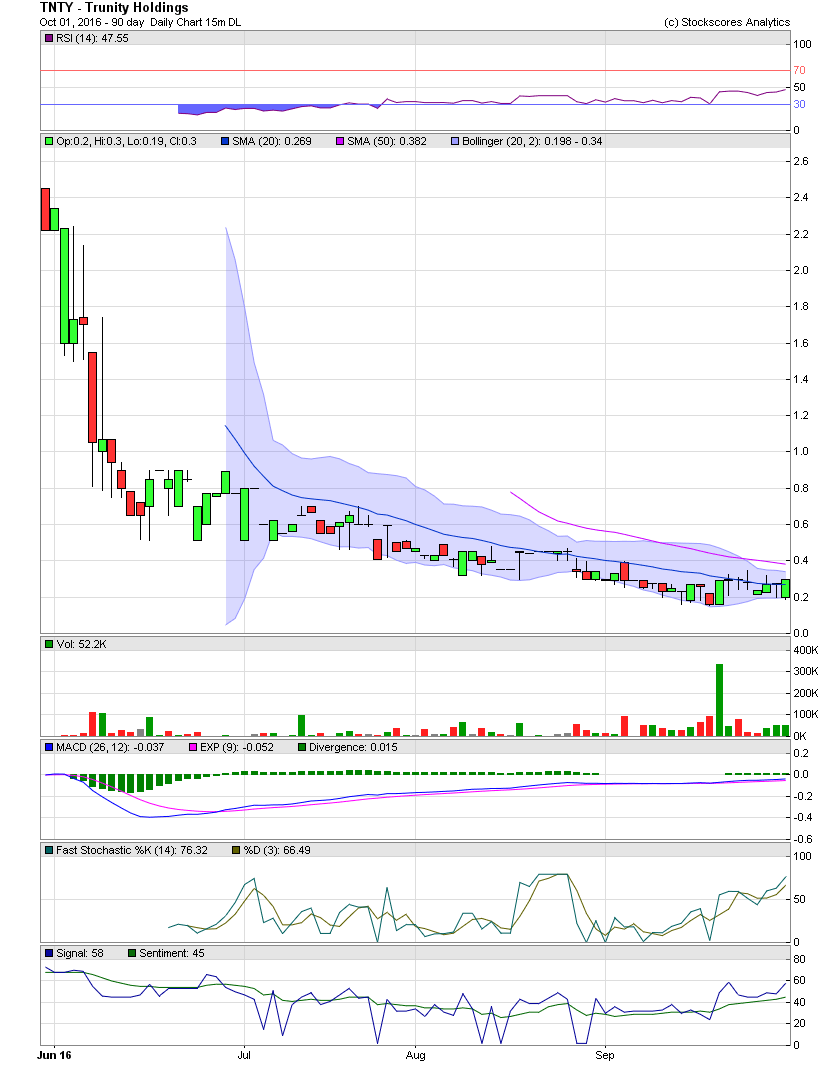
I'm posting two charts below. The first is a daily chart of a seven month period. The second one is the daily chart but only of a 3 month chart. I'm posting the shorter timeline so that one can better see the bollies and the moving averages. The bollies have tightened substantially from months ago. Although bollies narrowing doesn't forecast a move in one direction or the other, but rather that a move can be expected. Again, look at the volume, the basing of the share price, and Friday's move and close above the MA20. I'm looking for a continued move to the upside. GLTA
Please link back to my TNTY on late Sept 28 (post, #2335) for a short explanation of the chart and my technical opinion:
http://investorshangout.com/post/view?id=4085111
As mentioned in that post, I believed TNTY was getting ready to begin moving up and over its MA20, which hasn't been seen since May. On Friday, we saw the beginning of that move when the stock traded from an intraday low of .19 to close at .30. One can see on the charts below, the stock hasn't closed above its 20 day moving average since late May. The volume spike, that the stock saw approx two weeks ago, was a telling sign that investors saw value there and the low was probably seen. The stock hit an intraday low of .155 and has now doubled in price. As you can also see, the RSI has risen to almost 50 after months of trending near 30, and the MACD is getting ready for a move over its zero line. A Shareholder Update was released Friday. TNTY has some legs imo.
I'm posting two charts below. The first is a daily chart of a seven month period. The second one is the daily chart but only of a 3 month chart. I'm posting the shorter timeline so that one can better see the bollies and the moving averages. The bollies have tightened substantially from months ago. Although bollies narrowing doesn't forecast a move in one direction or the other, but rather that a move can be expected. Again, look at the volume, the basing of the share price, and Friday's move and close above the MA20. I'm looking for a continued move to the upside. GLTA
 (0)
(0) (0)
(0)