WFM Daily Chart ~ An Example of a Big Board Chart
Post# of 2561
Posted On: 06/16/2016 7:40:50 PM

WFM Daily Chart ~ An Example of a Big Board Chart
I'm still getting a few messages regarding the previous board conversations about charts and technicals and how a few still refer to the RSI at 70 and higher as the so called 'Power Zone'. One of these days, everyone reading this board is going to figure out that the 70 and higher territory of the RSI is the exact opposite of the totally falsely termed 'Power Zone'. It is the Nose Bleed Zone, period!
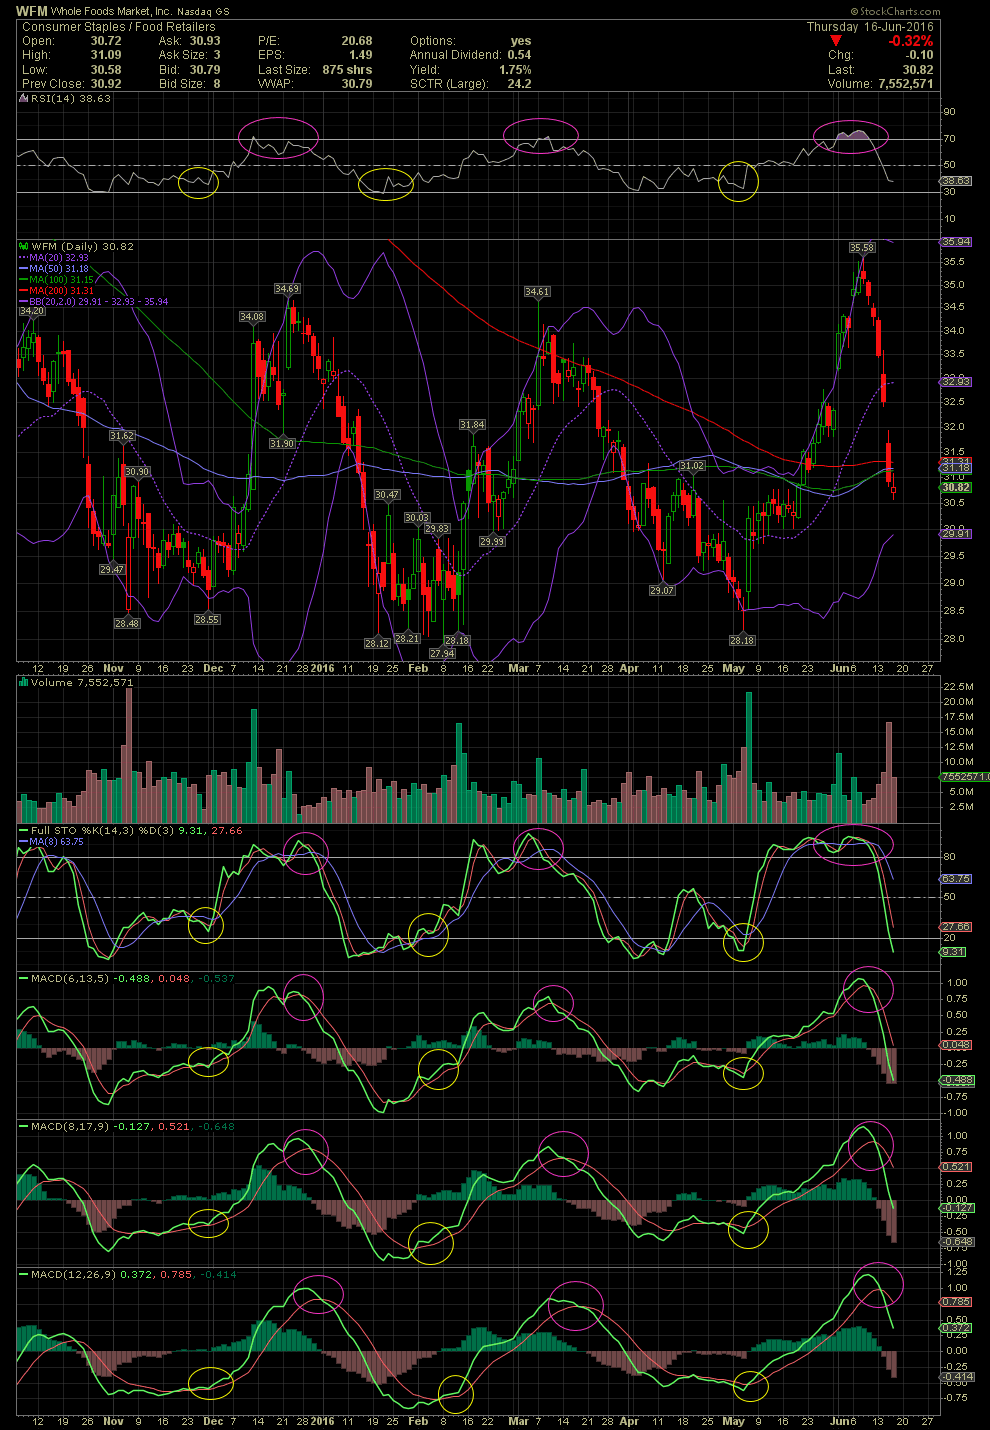
The counter argument from a few messages in PM is that I am only talking about the OTC, and with Big Board stocks, the RSI certainly is the 'Power Zone'..... Bullchit! See the chart below.
I will begin posting a big board stock every few days that will eventually prove to all here that the RSI at 70 and higher is a very respectable caution sign. Using it with the FullSto, MACDs and other indicators, it almost always proves to be the beginning of a correction. How far might a stock correct or pullback? No one knows. It could simple slow its appreciate until the upper bollie band catches up. A stock could trade sideways until back inside the bollie bands. It could also gradually begin to slip in price to within the bollie bands. Or a stock could selloff dramatically and return to within the bands very rapidly.
So when you read or hear someone screaming 'Power Zone!' on a stock you are in, I would highly suggest you get wise and stay on top of your investment, and begin thinking about a pullback.
Here's a Whole Foods Market chart. I have circled three instances where the RSI was at or above its 70 line. I have also circled the corresponding FullSto and MACDs negative crossovers. All the negative signals are in pink. I have also circled the positive crossovers, which are in yellow. Please note the levels of the RSI and other indicators. Now, you tell me about the 'Power Zone' versus the 'Nose Bleed Zone', and which is the correct title in regards to an entry or exit level. Learn your charting and technicals. These indicators are even more pronounced on an OTC issue than the Big Boards. But this works extremely well on both.
I'm still getting a few messages regarding the previous board conversations about charts and technicals and how a few still refer to the RSI at 70 and higher as the so called 'Power Zone'. One of these days, everyone reading this board is going to figure out that the 70 and higher territory of the RSI is the exact opposite of the totally falsely termed 'Power Zone'. It is the Nose Bleed Zone, period!
The counter argument from a few messages in PM is that I am only talking about the OTC, and with Big Board stocks, the RSI certainly is the 'Power Zone'..... Bullchit! See the chart below.
I will begin posting a big board stock every few days that will eventually prove to all here that the RSI at 70 and higher is a very respectable caution sign. Using it with the FullSto, MACDs and other indicators, it almost always proves to be the beginning of a correction. How far might a stock correct or pullback? No one knows. It could simple slow its appreciate until the upper bollie band catches up. A stock could trade sideways until back inside the bollie bands. It could also gradually begin to slip in price to within the bollie bands. Or a stock could selloff dramatically and return to within the bands very rapidly.
So when you read or hear someone screaming 'Power Zone!' on a stock you are in, I would highly suggest you get wise and stay on top of your investment, and begin thinking about a pullback.
Here's a Whole Foods Market chart. I have circled three instances where the RSI was at or above its 70 line. I have also circled the corresponding FullSto and MACDs negative crossovers. All the negative signals are in pink. I have also circled the positive crossovers, which are in yellow. Please note the levels of the RSI and other indicators. Now, you tell me about the 'Power Zone' versus the 'Nose Bleed Zone', and which is the correct title in regards to an entry or exit level. Learn your charting and technicals. These indicators are even more pronounced on an OTC issue than the Big Boards. But this works extremely well on both.
 (0)
(0) (0)
(0)