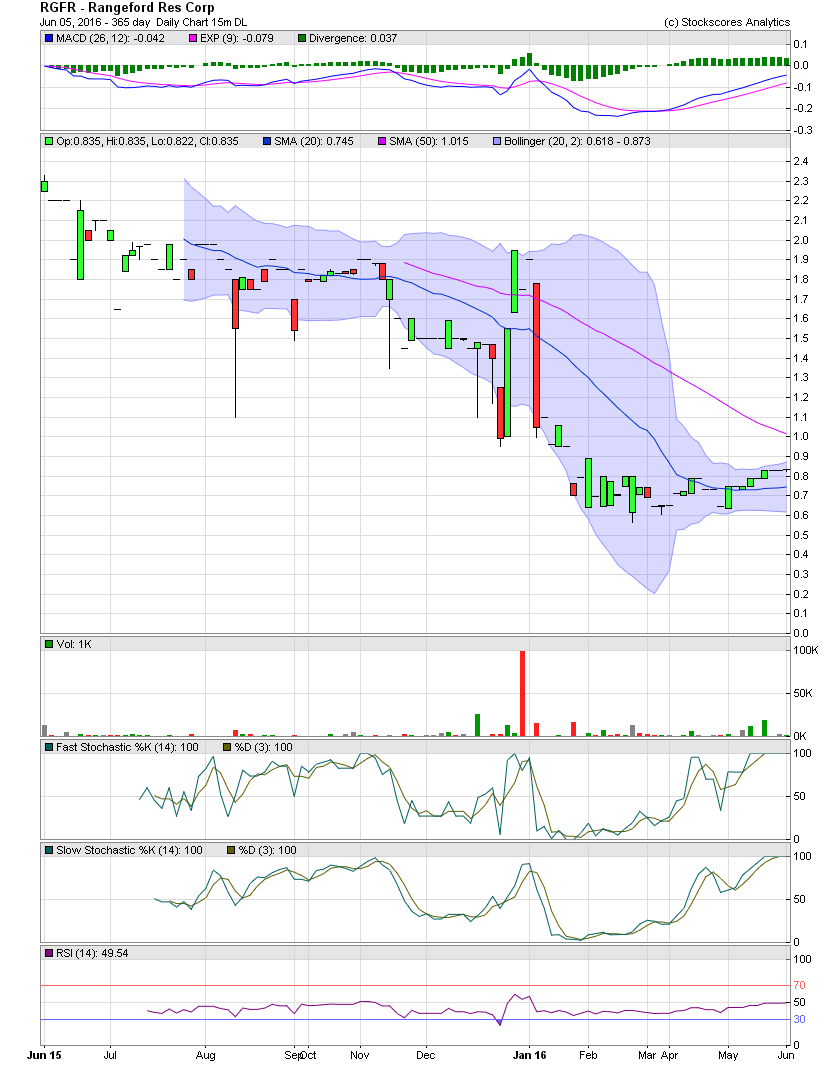
RGFR Daily Chart ~ Creeping Higher from the low .6
Post# of 2561

Now that RGFR has submitted three 8Ks and 4 news releases over the last three weeks, the stock has inched its way up from the .60s in early May to Friday's close of .835. On Friday's close, there was just one MM between .835 and $1.00. Looking at the chart and technicals, it appears a move and close above $1.00, which is also where the MA50 is at this time, would signal a quick move back to the high 1.00s and possibly over $2.00. The RSI is just beginning to cross its 50 line, and the MACD is still in oversold territory. So there's plenty of room to the upside before the technicals become overbought.

 (0)
(0) (0)
(0)