Hi Alj, I have a quick comment RXMD as to what
Post# of 2561
Posted On: 05/23/2016 6:13:50 PM

Hi Alj,
I have a quick comment RXMD as to what the technicals look like now compared to a few months ago. As I've mentioned often, one should not use just one indicator to base a qualified decision on when it comes to one's entries and exits. A few months ago, most all the indicators I use became very overbought.
The main item that I had to set straight is when someone comes to this board and begins to post trading myths like calling the RSI at 70 and higher the 'Power Zone', when if fact it is the Nose Bleed Zone. It typically forewarns of likely change in direction/momentum.
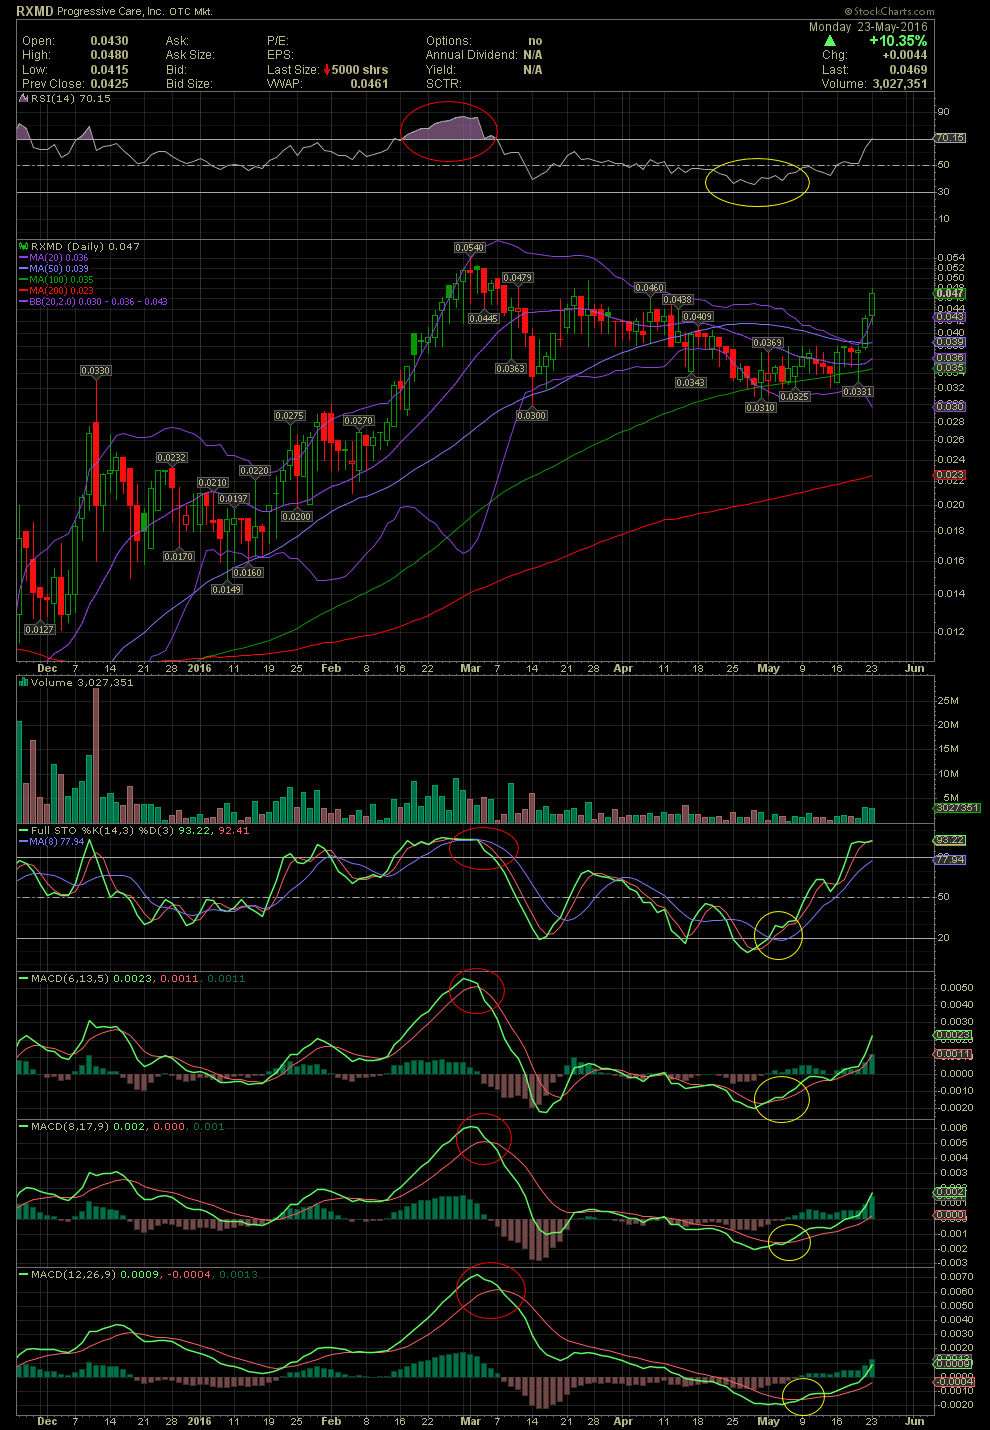
Below is today's chart which shows the RSI entering the overbought area, although just slightly. Additionally, today's candle is completely outside the upper bollie, which can not last long. How the candles return to within the bollies is unknown. The share price could gradually slow. It could trade sideways, it could slowly drop, or it can drop quickly to back within the bands. It will return within the bollies in short order, guaranteed.
The difference in today's chart as compared to the late Feb and early March is that the MACDs are nowhere near the overbought levels of the previous period of tops. As you saw with my chart over the weekend, the time to sell some or all RXMD was when the indicators were suggesting that the chart was overbought. This wasn't in highlight because I shared my technicals and reasons for selling when the top was forming. As I pointed out in this weekend's chart, the indicators had reset and the .03s were a very appealing and calculated entry or re-entry. The MACDs have plenty of room to move. I would look for a retest of the previous high of .054. Should that horizontal resistance point be broken, then obviously the stock will run to higher prices. The next likely point of resistance can be seen on the Weekly Chart, which I would say are the tops of .08 and then .10, seen well over one year ago. Looking like another solid swing trade is underway. GLTA
I have a quick comment RXMD as to what the technicals look like now compared to a few months ago. As I've mentioned often, one should not use just one indicator to base a qualified decision on when it comes to one's entries and exits. A few months ago, most all the indicators I use became very overbought.
The main item that I had to set straight is when someone comes to this board and begins to post trading myths like calling the RSI at 70 and higher the 'Power Zone', when if fact it is the Nose Bleed Zone. It typically forewarns of likely change in direction/momentum.
Below is today's chart which shows the RSI entering the overbought area, although just slightly. Additionally, today's candle is completely outside the upper bollie, which can not last long. How the candles return to within the bollies is unknown. The share price could gradually slow. It could trade sideways, it could slowly drop, or it can drop quickly to back within the bands. It will return within the bollies in short order, guaranteed.
The difference in today's chart as compared to the late Feb and early March is that the MACDs are nowhere near the overbought levels of the previous period of tops. As you saw with my chart over the weekend, the time to sell some or all RXMD was when the indicators were suggesting that the chart was overbought. This wasn't in highlight because I shared my technicals and reasons for selling when the top was forming. As I pointed out in this weekend's chart, the indicators had reset and the .03s were a very appealing and calculated entry or re-entry. The MACDs have plenty of room to move. I would look for a retest of the previous high of .054. Should that horizontal resistance point be broken, then obviously the stock will run to higher prices. The next likely point of resistance can be seen on the Weekly Chart, which I would say are the tops of .08 and then .10, seen well over one year ago. Looking like another solid swing trade is underway. GLTA
 (0)
(0) (0)
(0)