HNGR Daily Chart ~ Reversal Still Underway As m
Post# of 2561
Posted On: 03/14/2016 4:35:15 PM

HNGR Daily Chart ~ Reversal Still Underway
As most of you know who follow me around, I picked up some HNGR from a scan just over a week ago. There wasn't an Investors Hangout MVP Contest last week, but this week Joe1979 set up a contest for $1.00 or higher priced stocks. I chose HNGR as you can see over on the MVP board:
http://investorshangout.com/post/view?id=3616942
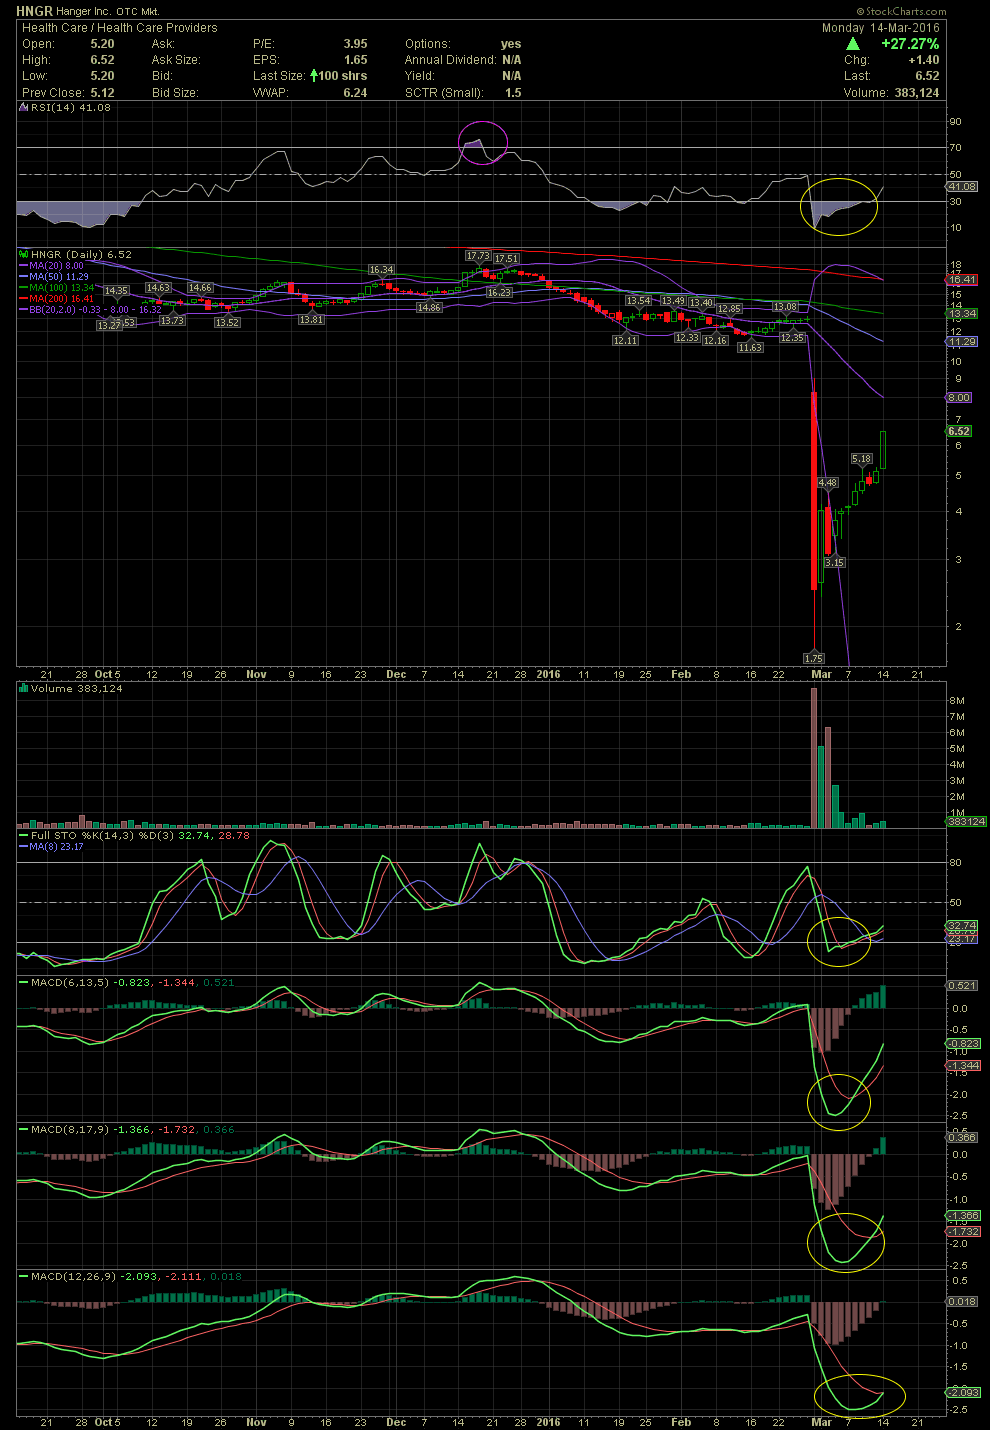
Here's the chart and the reasons I entered it last week. Just as I have been hammering the falsely termed RSI 'power zone' when near 70 or higher, the exact same holds for those stocks when they became very oversold with RSI readings of less that 30, as long as they are accompanied with very oversold FullSto and MACDs. As you can see on the chart below, the RSI had reset from the Nose Bleed Zone in mid December. The stock was trading in excess of $17.70 at the time. Since then, the stock drifted downwards along with the weakening indicators. When the poop hit the fan two weeks ago, look at where the indicators fell to; very oversold conditions.
Once again, there's nothing 'powerful' about the RSI over 70. How a stock resets from overbought territory is anyone's guess. It could simply slow its ascent, trend sideways, decline slowly, or see a red waterfall as what occurred to HNGR in late February. Just as the RSI near 70 is a caution flag and typically a sell signal, when it falls into extremely over sold levels, it because a signal to get ready to enter.
It's not that difficult folks. Use those charts and technicals. GLTA
As most of you know who follow me around, I picked up some HNGR from a scan just over a week ago. There wasn't an Investors Hangout MVP Contest last week, but this week Joe1979 set up a contest for $1.00 or higher priced stocks. I chose HNGR as you can see over on the MVP board:
http://investorshangout.com/post/view?id=3616942
Here's the chart and the reasons I entered it last week. Just as I have been hammering the falsely termed RSI 'power zone' when near 70 or higher, the exact same holds for those stocks when they became very oversold with RSI readings of less that 30, as long as they are accompanied with very oversold FullSto and MACDs. As you can see on the chart below, the RSI had reset from the Nose Bleed Zone in mid December. The stock was trading in excess of $17.70 at the time. Since then, the stock drifted downwards along with the weakening indicators. When the poop hit the fan two weeks ago, look at where the indicators fell to; very oversold conditions.
Once again, there's nothing 'powerful' about the RSI over 70. How a stock resets from overbought territory is anyone's guess. It could simply slow its ascent, trend sideways, decline slowly, or see a red waterfall as what occurred to HNGR in late February. Just as the RSI near 70 is a caution flag and typically a sell signal, when it falls into extremely over sold levels, it because a signal to get ready to enter.
It's not that difficult folks. Use those charts and technicals. GLTA
 (0)
(0) (0)
(0)