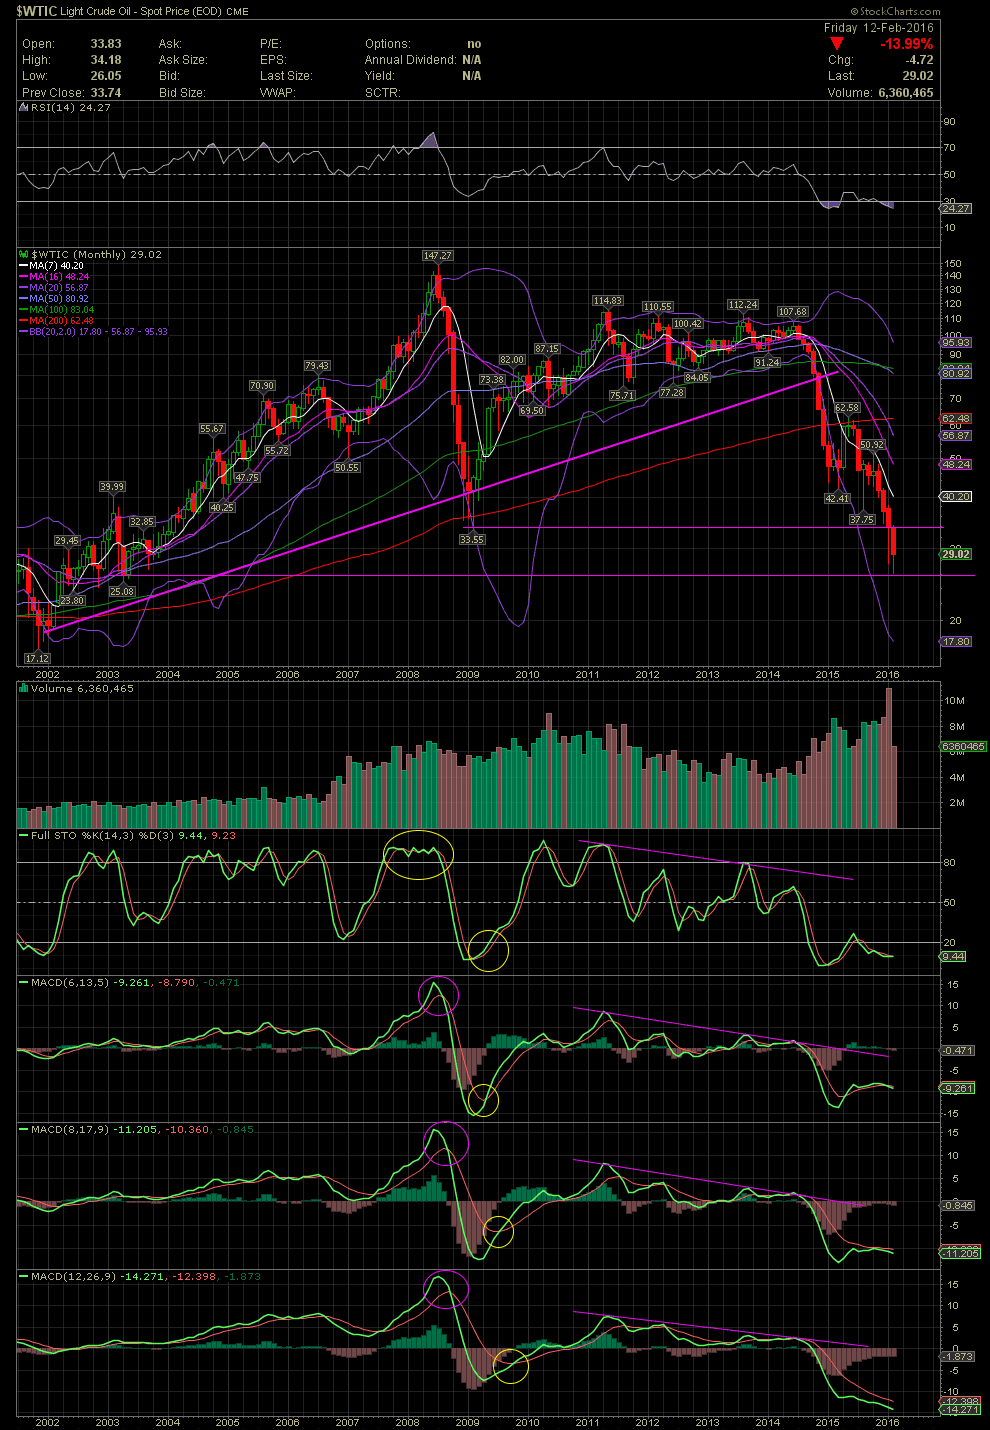
Oil Daily Chart ~ Still in Decline but Attempting
Post# of 2561

Using just the daily chart and technicals, it wasn't all that difficult to see what began with oil months ago. After a sharp decline, which ended in late August, the technicals suggested a rally was upon us. The downside began again with the rally into the MA200 and the subsequent failure to close over that moving average resulting in another decline. One might ask where the support might have been during this collapse. I'll post a 15 Year, Monthly Chart next for two levels that might have offered support for those who were looking for levels of entry into the Oil Sector. The first failed to hold in January. The second is being tested in February.

 (0)
(0) (0)
(0)