IORG Daily Chart ~ IORG Closes at Another Multi Ye
Post# of 2561
Posted On: 02/03/2016 12:51:48 AM

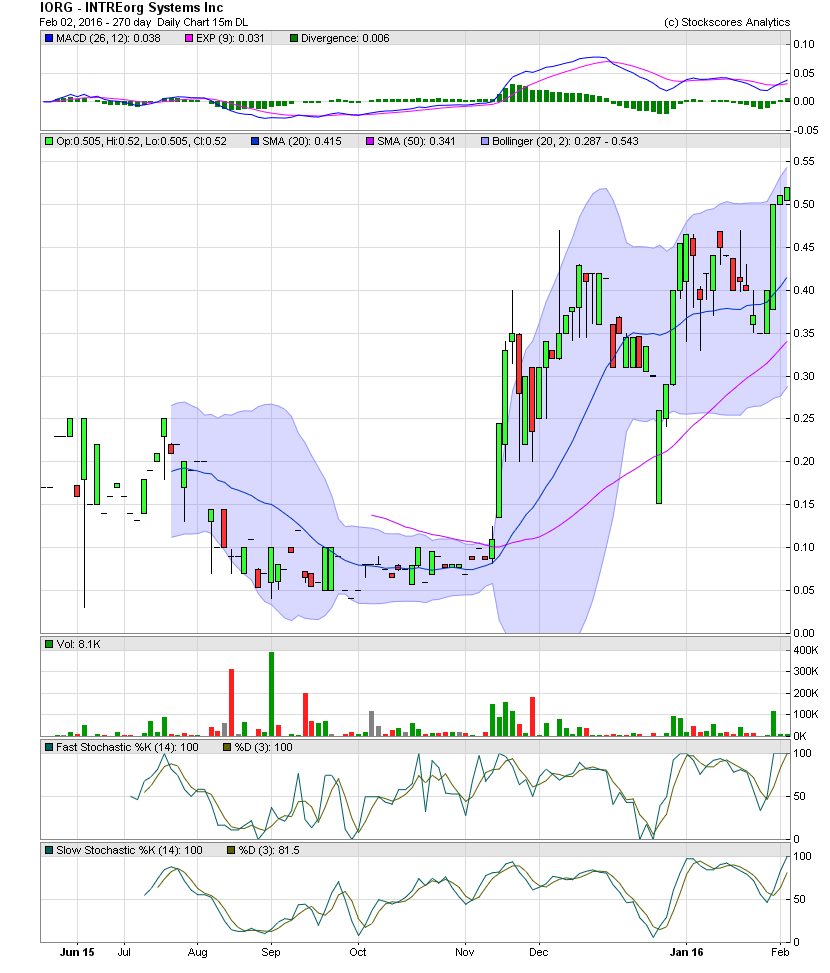
IORG Daily Chart ~ IORG Closes at Another Multi Year High
Although only up .01 on Tuesday, IORG closed at .52 for yet another multi year high despite the Dow getting hit for a loss of 295.64. During the decline on the Dow from almost 18,000 to a low of 15,450.56 just two weeks ago before closing today at 16,153.54, IORG has risen from the teens to .52, a sign of strength in a crap OTC and Big Board market.
Please link back to my previous IORG Monthly Chart post - http://investorshangout.com/post/view?id=3518189 - for a look at the trading history. Another .03 to .55, and IORG will have seen its highest trading since late 2011. Something is definitely underway by the looks of the chart and the strength of the stock in an OTC bear market. New highs in a stock during a bear market is a great sign of things to come. The Daily Chart below reflects the recent trading of IORG during the weak market to include the Dow. GLTA
 (0)
(0) (0)
(0)