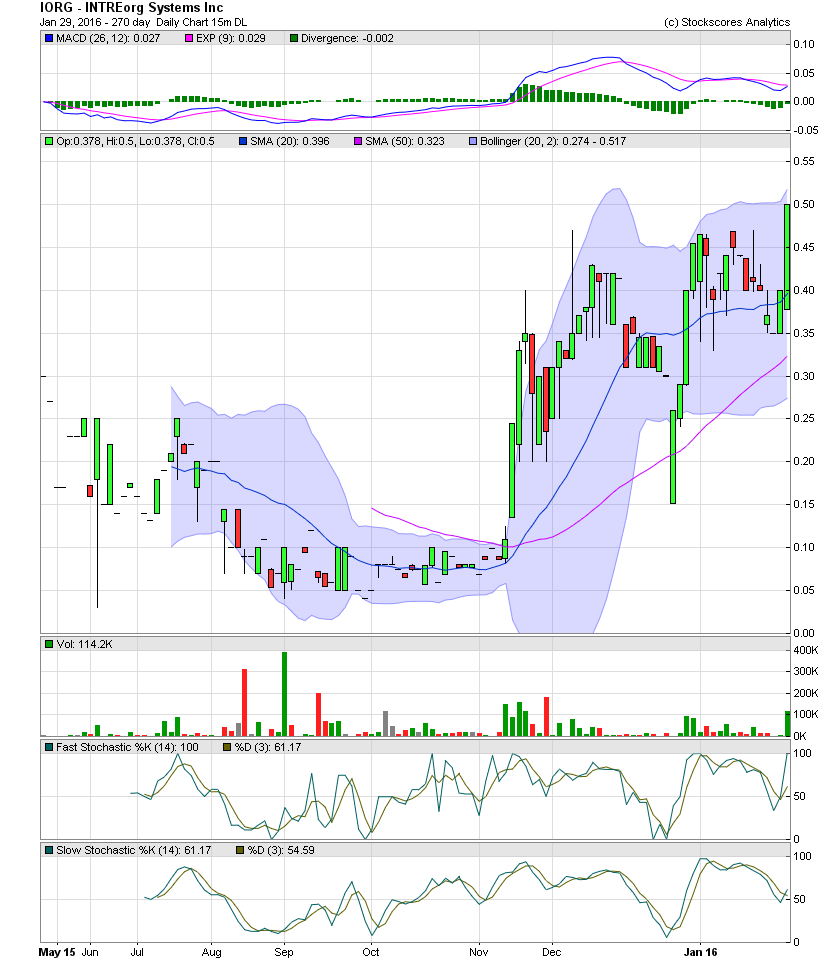
IORG Daily Chart ~ Highest Close Since Mid 2012
Post# of 2561

I will be posting a second chart of IORG, which will be a monthly chart with a 7 year price history for the reasons of showing where I believe the resistance levels and breakout points can be expected to be met. IORG closed at .50 for its highest close since mid 2012. Since I shared the stock at .08 x .15 in mid November, the stock has traded well as you can see below. From the initial move at .08, IORG moved to .40 before retracing to .20. The next leg up saw an intraday share price of .47. Another low volume selloff happened next to a low of .15 followed by another move up to a close of .465. The consolidation in January saw the share price fluctuate between .35 to the mid .40s. Friday pop on over 114,500 shares while setting a 3.5 year closing high. Although the new high, one can see that the upper bollie band is rising, so there's no immediate issues about the candle(s) being outside the bollie. StockCharts.com doesn't cover IORG, so the only chart I can share is the one below. I don't subscribe to their service, so the technical indicators I normally follow aren't reflected here.
As to the fundamental side of things, I would suggest to visit the IORG website. There is some powerful information there to read and absorb. If management executes as they state, IORG could be a big one as a few of us have seen with PFHO and IVE of years ago.
Here's your link: http://intreorg.com

 (0)
(0) (0)
(0)