INDU Daily Chart ~ Selloff Shouldn't Have Been a S
Post# of 2561

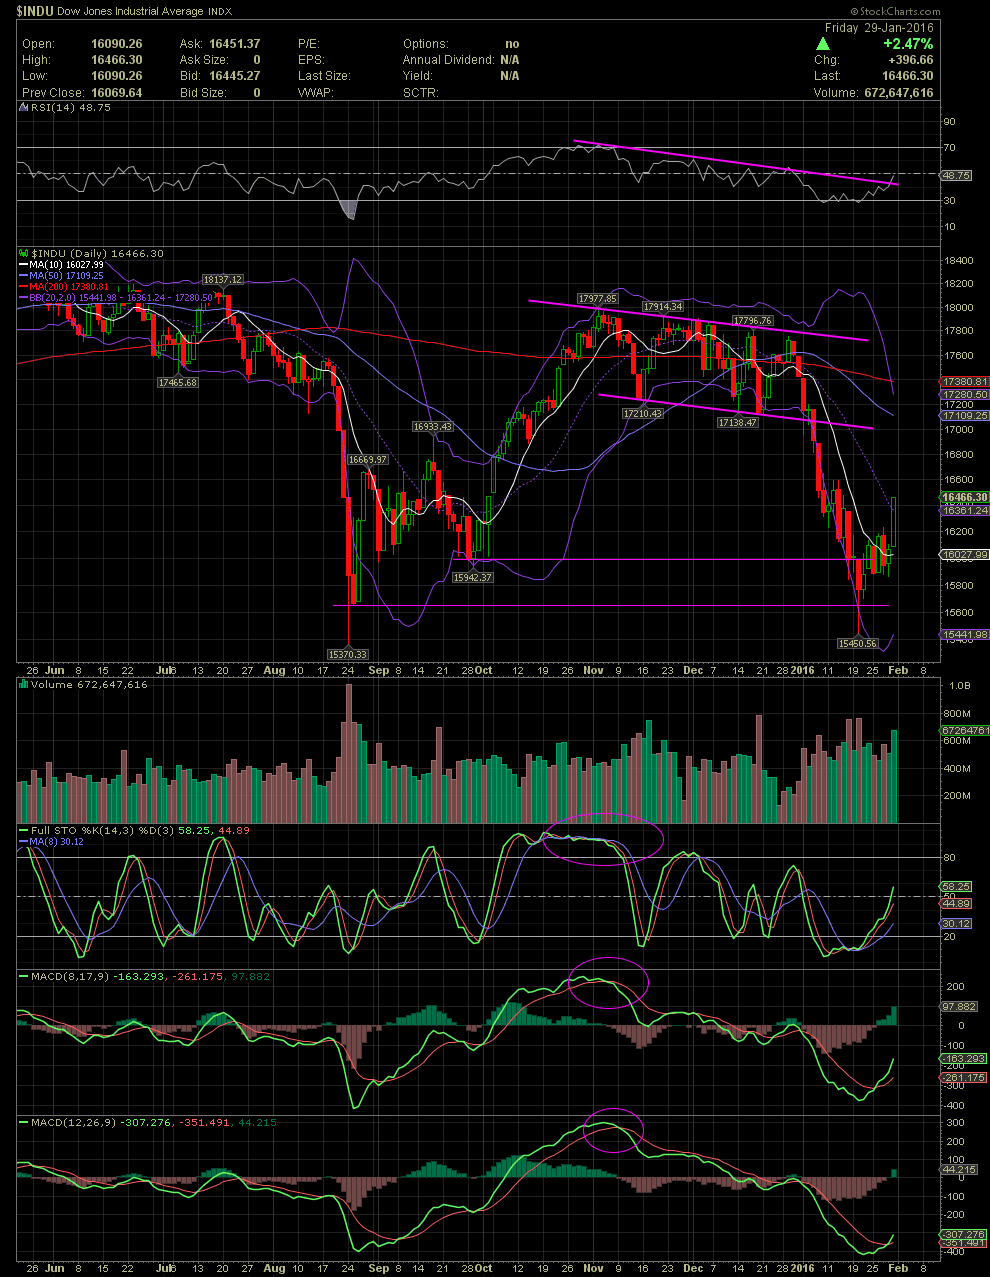
Scroll back to post 2120 if you would like to see a quick review of what was expected. After the lower support line of the declining channel the Dow was trending in since early November, the market broke down to the first lines of support at the previous lows of late Sept/early Oct at 15,942 followed by the late Aug low of 15,370. The Dow reversed at an intraday low of 15,450. Near those lows, it clear to see that the FullSto and MACDs were in very oversold conditions. Is the subsequent reversal just a bounce from oversold levels or going much higher? Who knows, but use the chart and technicals to better calculate your entries and exits. Currently the Dow did close above the MA20, which is also the Middle Bollie. With any follow through to the upside, the next target would be the MA50 near 17,100 currently.

 (0)
(0) (0)
(0)