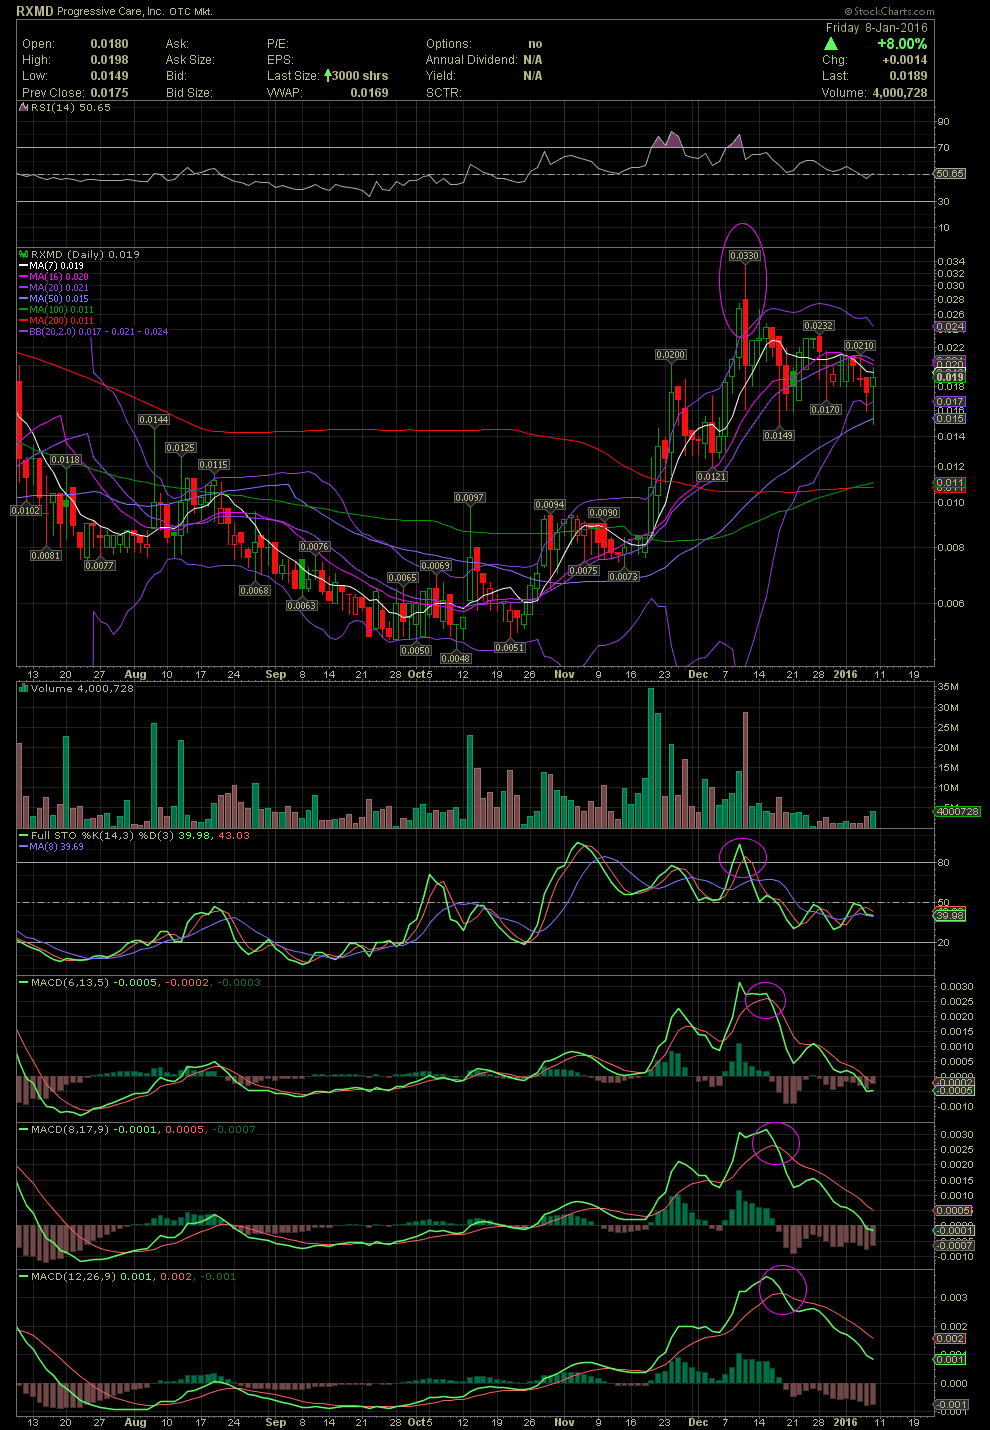
RXMD Daily Chart ~ A Stock from MoneyForNothing
Post# of 2561

Hi Money,
I have to apologize for not getting back earlier. I still haven't found the time to dig into the fundamentals of RXMD that you shared with us here. As you know, I was on the East Coast for over three weeks for the birthday of out granddaughter. After being gone that long, I'm swamped with getting caught up for ECO Integrated Technologies, which you'll all hear about later this year when that company begins to trade.
Since I haven't had time for the fundamentals behind RXMD, I'll just post a quick chart with my thoughts regarding the technicals. In mid December, the stock traded substantially outside the upper bollie. The members of this board know what always happens when that occurs. The stock will either slow its advance until the indicator catches up, trade sideways until back inside the bollie bands, or drop sharply back within. RXMD is now trading back inside the bands but then the opposite occurred during the retreat. Friday's trading saw the stock trade slight outside the lower band and also bounce off the MA50. You and I spoke briefly about that possible bounce, and now we've seen it. What the stock saw over the last month was the RSI in the overbought level. While most everyone screams about the "Power Zone" of the RSI above the 70 line, I always consider this lagging indicator being above that line as the "Nose Bleed Section". Power Zone bs, lol. That period, along with the stock outside the upper bollie, also saw the FullSto and MACDs begin curling from their overbought levels. The subsequent negative crossovers and divergence to the downside has witnessed the share price falling from a high of .033 to the intraday low of Friday at .0149 before a technical bounce from the MA50 and closing at .019.
Without knowing anything of the fundamentals yet, I personally wouldn't enter at this point solely based on the technical factors. Had I been in the stock prior to mid December, I would have used the moon-shot outside the upper bollie as a sell signal and would be waiting now for a reset of the technicals. Keep in mind, news will almost always trump the technicals. So despite my reluctance to jump in now, any strong news would more than likely take the stock higher, and the indicators would respond to that buying pressure.

 (0)
(0) (0)
(0)