IORG Daily Chart ~ Setting Up for a New High Th
Post# of 2561
Posted On: 01/10/2016 1:20:05 PM

IORG Daily Chart ~ Setting Up for a New High
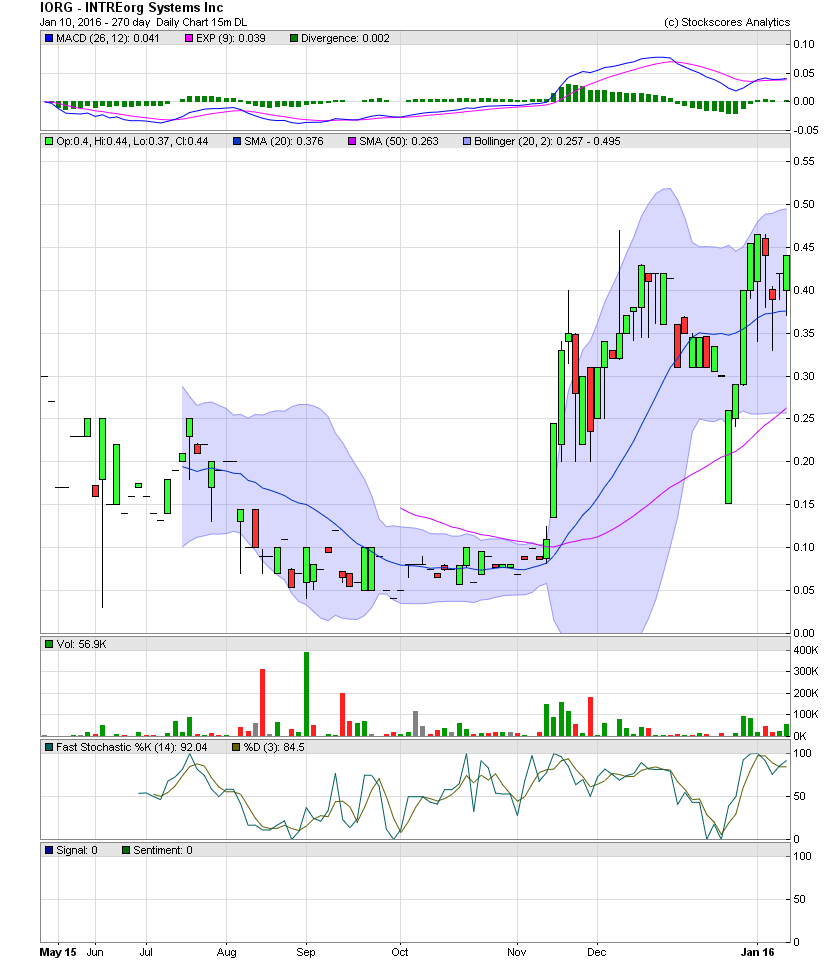
This one is getting exciting now. The stock is being absorbed during every decline with quick recoveries from where the stock came from. As far as I have been able to learn, the OS is approx 14.2MM with a float of just 5.1MM. With the way INTREorg has become so volatile, my guess is that this stock is not being flipped but rather accumulated heavily. One can see the first leg which took the stock from the .07/.08s into the .40s. Since mid December, the stock saw a sharp decline to .15 and over the next few trading days right back into the .40s. I really like this chart for a potential huge breakout as you'll be able to see on my next chart, which is a 6 year chart showing the longer term view. StockCharts.com doesn't carry IORG, so all I have to share is the chart below. I'm not a subscriber to this service, so my technicals are limited. GLTA
This one is getting exciting now. The stock is being absorbed during every decline with quick recoveries from where the stock came from. As far as I have been able to learn, the OS is approx 14.2MM with a float of just 5.1MM. With the way INTREorg has become so volatile, my guess is that this stock is not being flipped but rather accumulated heavily. One can see the first leg which took the stock from the .07/.08s into the .40s. Since mid December, the stock saw a sharp decline to .15 and over the next few trading days right back into the .40s. I really like this chart for a potential huge breakout as you'll be able to see on my next chart, which is a 6 year chart showing the longer term view. StockCharts.com doesn't carry IORG, so all I have to share is the chart below. I'm not a subscriber to this service, so my technicals are limited. GLTA
 (0)
(0) (0)
(0)