MDMN Daily Chart ~ Another Successful Trade Behind
Post# of 2561
Posted On: 01/10/2016 12:24:37 PM

MDMN Daily Chart ~ Another Successful Trade Behind Us
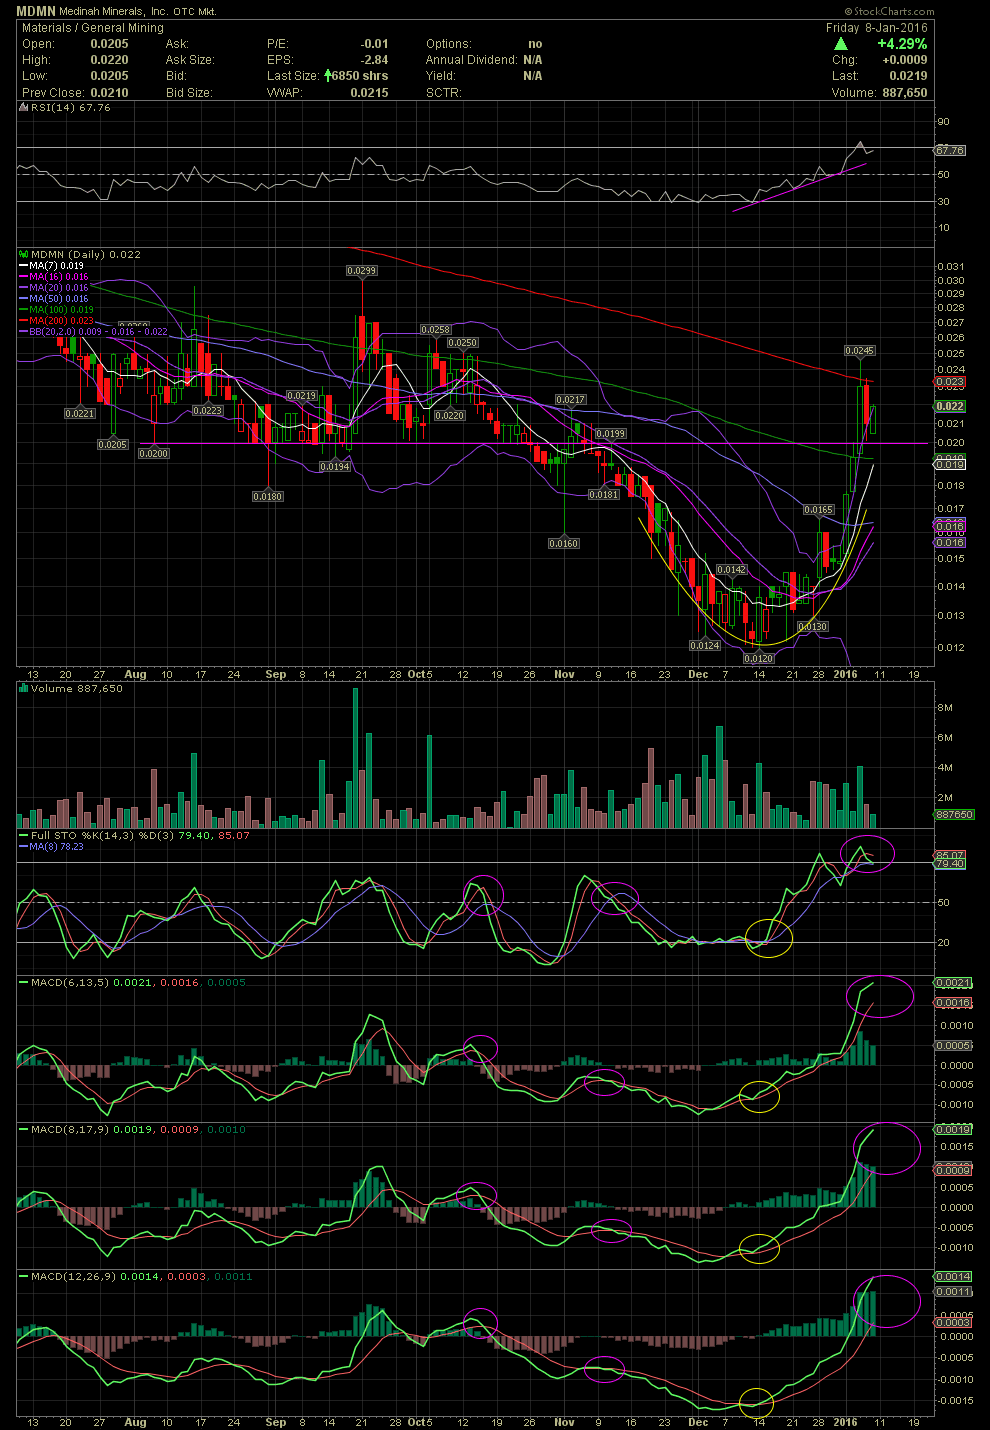
Although I don't normally share the MDMN chart, a few of us have been swing trading the stock for quite a while. I wished I had been swing trading MDMN over the last 10-15 years, as it's one of the easiest OTC stocks to swing. But I drank the koolaid for many years. I was asked on Wednesday to post a chart over the weekend. I'll simply discuss our last entry and exit, and the reasons why. We aren't in the stock at the moment.
In early and mid December in Skype and another stock message site, I mentioned that MDMN was beginning to establish a bottom in the .0122/.0124 area. Look at the oversold levels of the FullSto and MACDs during that period, and it should have been clear to anyone that this level could make for a very nice entry. At least six of us entered the trade with the first line of resistance in mind at the MA50 (blue line). Five of us sold and actually re-entered from .0149 -.0152 and added at .0168-.0173 as the share price broke over the MA50. The next line of resistance for me was the previous lows of .02 which turned from a support line to a resistance line when the stock broke below it back in late October. I had mentioned that if the stock broke above .02, the next likely resistance line would be the MA200 (red line). My friends and I entered GTC orders from .0225 to .0232, and they were all executed.
Now we wait for our next calculated entry. As you can see on the chart, the indicators have not yet crossed over to the downside, but with the FullSto and MACDs in overbought territory, it doesn't make sense to stay in the stock and keep our fingers crossed for higher prices. We attained our targets, sold for gains over 80%, and now we'll see if the stock can break above that MA200, consolidate or decline. I'm not able to state with any certainty that MDMN will go in one direction or the other. I might add that those of us that we in the trade put our profits into additional IORG stock last week. I'll get to that chart later today. GLTA
 (0)
(0) (0)
(0)