INDU Daily Chart ~ The Declines Are No Surprise
Post# of 2561
Posted On: 01/10/2016 11:45:50 AM

INDU Daily Chart ~ The Declines Are No Surprise
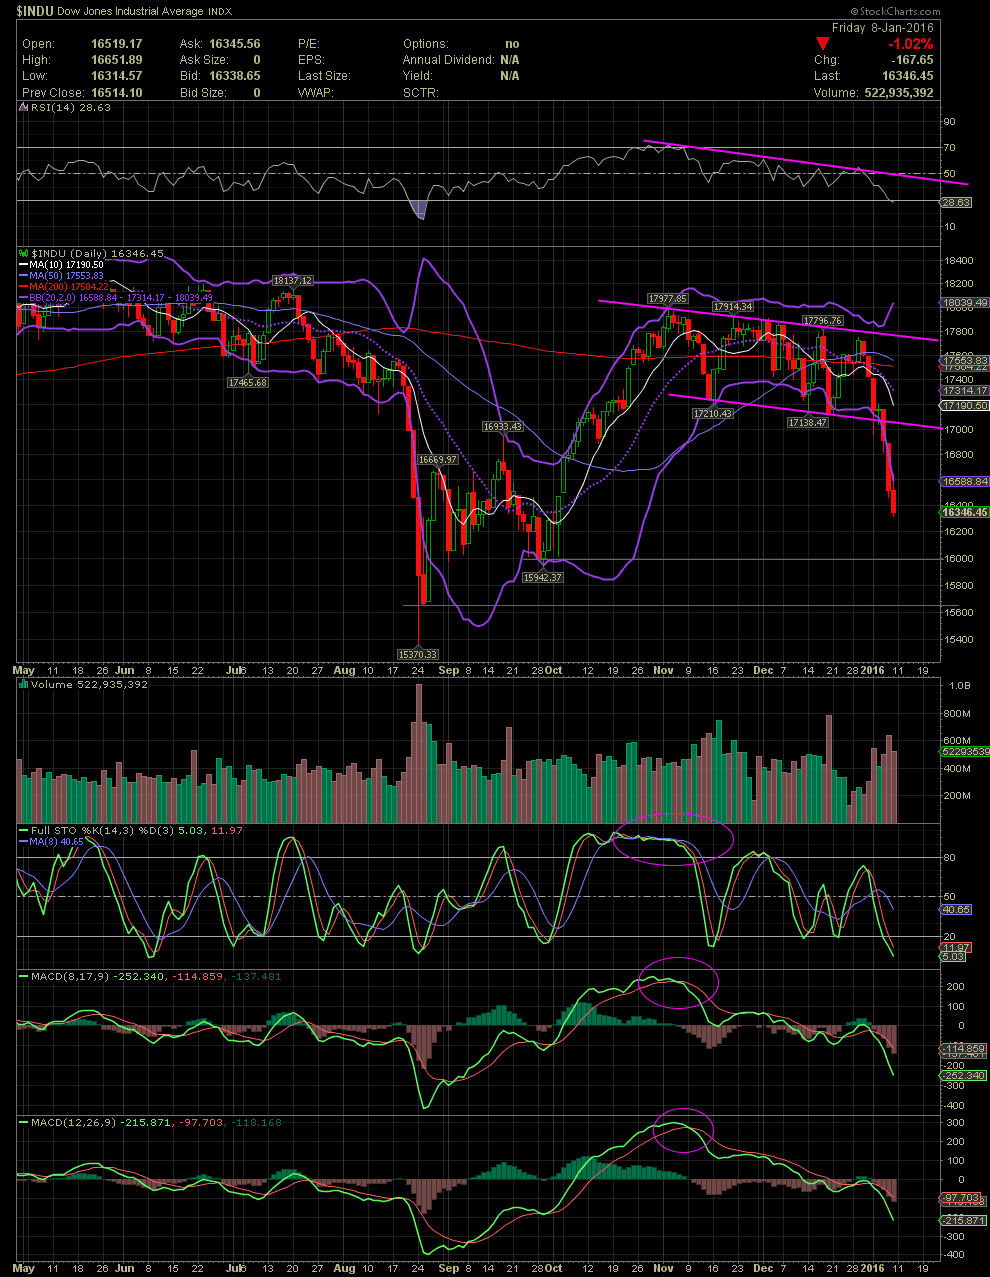
With the current declining of the big boards, there should be no surprise to anyone who knows how to read a chart. One simply needs to use the same technicals within my charts and apply them for any index or stock chart.
In the case of the Dow and S&P, the talking heads on the various news outlets are telling you that the decline of this last week had to do with China, lower oil prices, blah, blah, blah. Those reading and understanding charts and the technicals already saw this decline developing in early November, when the FullSto and MACDs began to go negative. The divergence of the indicator and signal lines to the downside is gaining speed now as you can see on the chart below. Additionally, look at the declining tops line and the Dow's inability to break above it since it was established at 17,997.85. One can see the lower lows being set from mid November into last week. I've drawn the declining channel (tops and lows). The lower end of the channel failed to hold on Wednesday, and the drop accelerated. For over two months, the index was rising and falling above and below the MA200 (red line). We could be close to a capitulation selloff shortly. First line of support would be the previous low of late Sept/early Oct at 15,942 followed by the late Aug low of 15,370. If the Dow gets there, I'll begin posting a longer term chart in the attempt to find the next potential support levels.
 (0)
(0) (0)
(0)