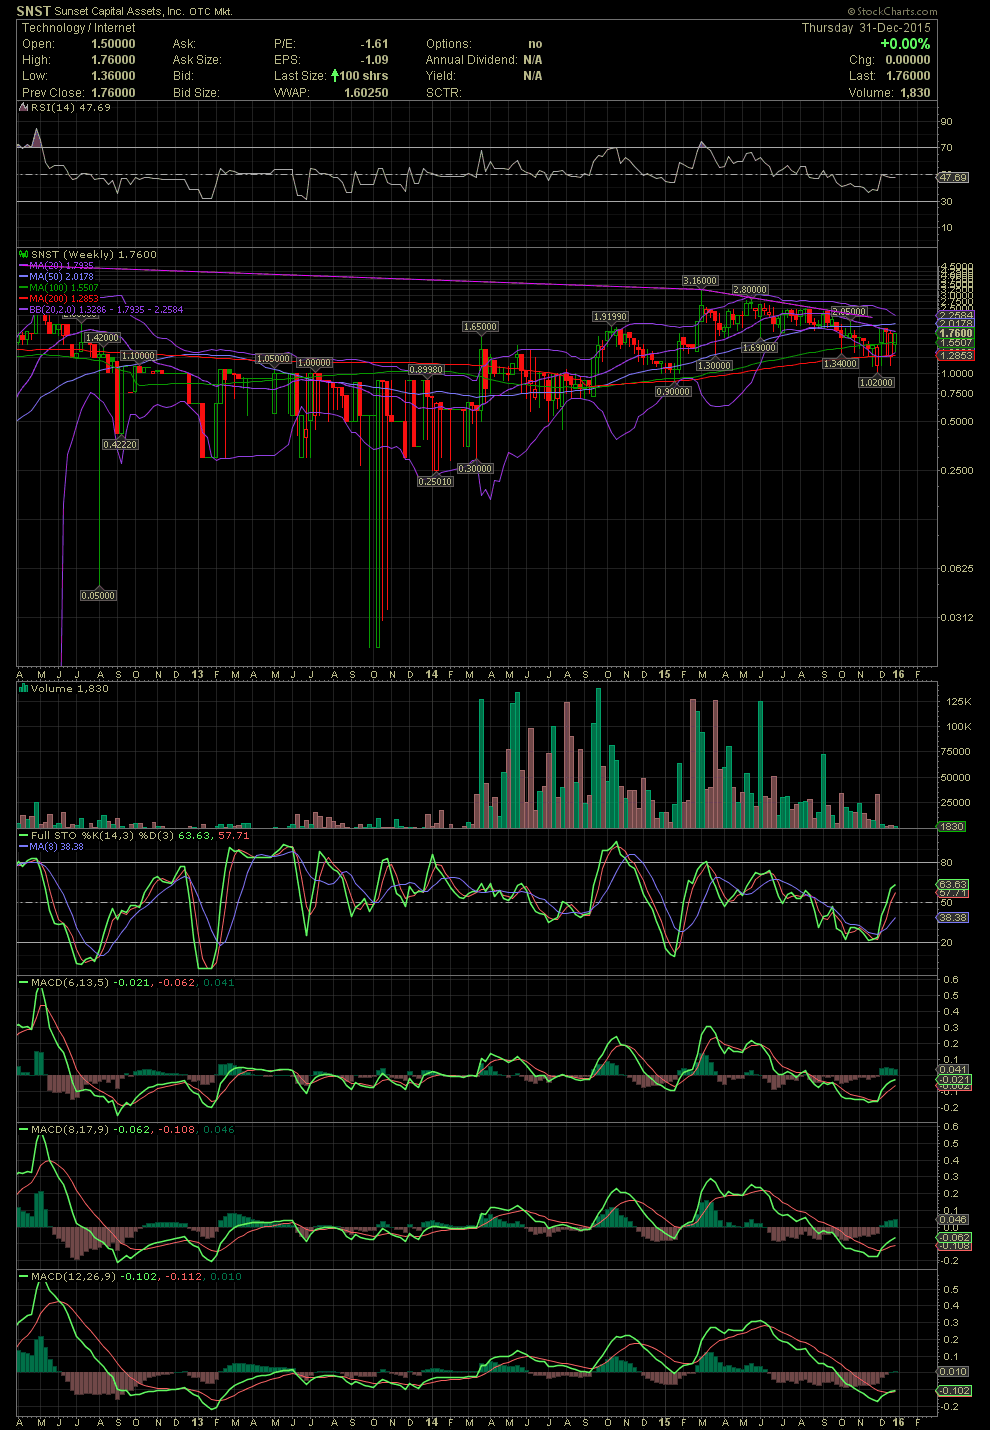
SNST Weekly Chart ~ Set For Liftoff? As mention
Post# of 2561

As mentioned in my previous post, check the volume spike in early 2014 and the subsequent surge in share price over the months that followed the initial volume increase. The recent decline in volume, along with the very volatile intraday swings on the daily chart, is reminiscent of the days when a few of us began accumulating shares under .40. Please note the positioning of the FullSto and MACDs as they begin a positive crossover from very oversold levels on this weekly chart.

 (0)
(0) (0)
(0)