IORG Daily Chart ~ Another Solid Day and a Multi Y
Post# of 2561

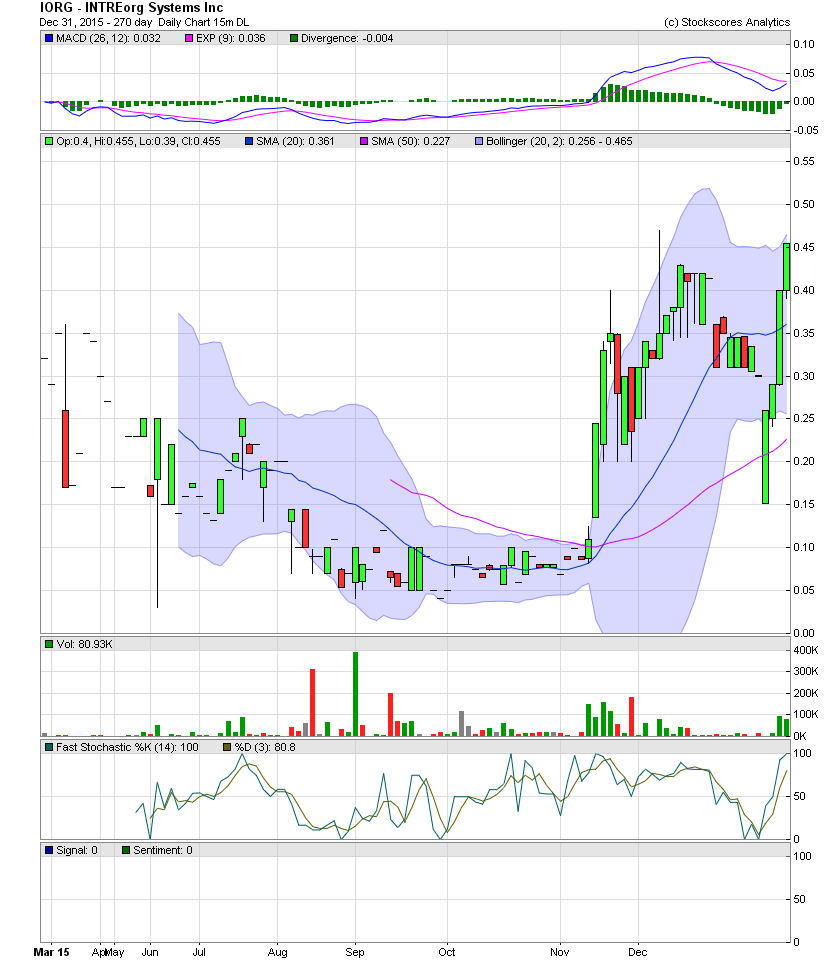
INTREorg Systems came roaring back this week from a Monday morning opening of .15 to close at .454. As I mentioned earlier this week, at .15 the share price was substantially outside the lower bollie. And as with cautionary and exit signals when a candle is significantly outside the upper bollie, the same occurs when a candle is too far outside the lower bollie, they always come back inside the bollinger bands. Wednesday and Thursday also saw the highest volume days since mid November when we first began accumulating IORG in the .08 area. Yesterday's close of .454 was also a multi year high for those following along. My next post will show a 7 year chart for all to see the last time IORG traded at this level.
When you find a good company, real management, and a strong business plan being executed, the selloffs and dips, as we witnessed over the last week, simply have to be taken advantage of. Congratulations to all that entered or added from .15 into the .40s. Awesome job!

 (0)
(0) (0)
(0)