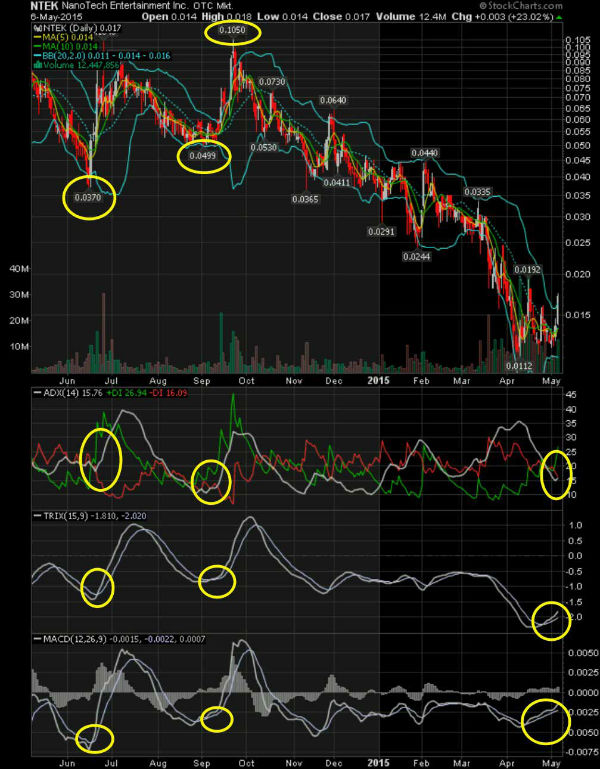
Chart analysis, we are on the cusp of a major run. Twice in the past year we had this type of a chart set up. Notice the ADX (white line) and when it has crossed the -DI (red line). The first time this happened was last June, pps went from .037 to .104, a 181% gain. Second occurrence was in September, we ran from .0499 to .105, a 110% gain. Further confirmation of a run comes from the Trix and MACD lines crossing and heading north. Add up those three indicators and it means the stars are aligned for a major correction.


 (0)
(0) (0)
(0)

 (0)
(0) (0)
(0)