SNDY ~ END of the WEEK CHART............ After
Post# of 2561

SNDY ~ END of the WEEK CHART............
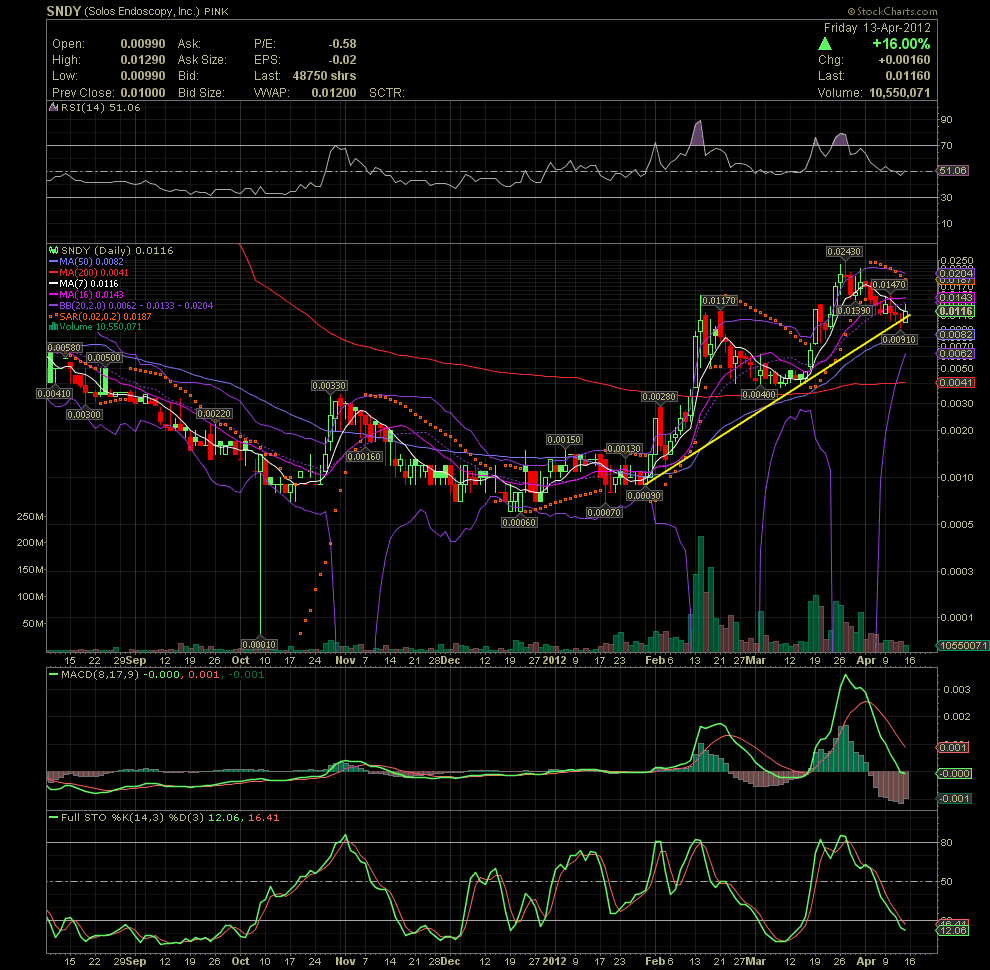
After a tremendous run from .0008 in January, SNDY has witnessed a couple of nice corrections. The current one we are in is coming to an end. Most of the indicators that I follow have just about recent and appear ready to turn up again. The rising channel is close to being broken, but I thnk it will hold as the MACD is beginning to flatten out, the Full Sto is in oversold territory, and the RSI has moved back above the 50 line. Not all that pretty yet, but since the stock is trading at .0115, and I believe getting ready for the next leg up, SNDY might not be a bad one to take a position in.

 (0)
(0) (0)
(0)