CHART: $1,200 gold price the new normal? Frik Els
Post# of 23222
Posted On: 12/29/2014 12:20:12 AM

CHART: $1,200 gold price the new normal?
Frik Els | December 28, 2014
CHART: $1,200 gold price the new normal? Lion Chrome Smelter in South Africa. Source: Glencore
CHART: $1,200 gold price the new normal?
Lion Chrome Smelter in South Africa. Source: Glencore
After closing 2013 at $1,205 an ounce the price of gold jumped out of the starting gate, rising consistently to reach a high of $1,380 in March.
But the metal failed to consolidate gains during the summer doldrums, falling to a near four-year low November 6 at $1,143.
The recovery from there was swift and gold is heading into the final week of 2014 basically where it started the year.
Gold 2014's highs and lows were 20% or $237 apart, making it the quietest year since 2008. Last year it was 40% or $488 – gold's most volatile 12 months since crazy 1980.
Gold miners' problems are only exacerbated by falling by-product credits
The subdued trading in gold came despite potential market shocks including the slide in oil, the rampant dollar and a variety of geopolitical shocks during 2014.
The gold price is the most sentiment-driven of all commodities, but fundamentals still do matter.
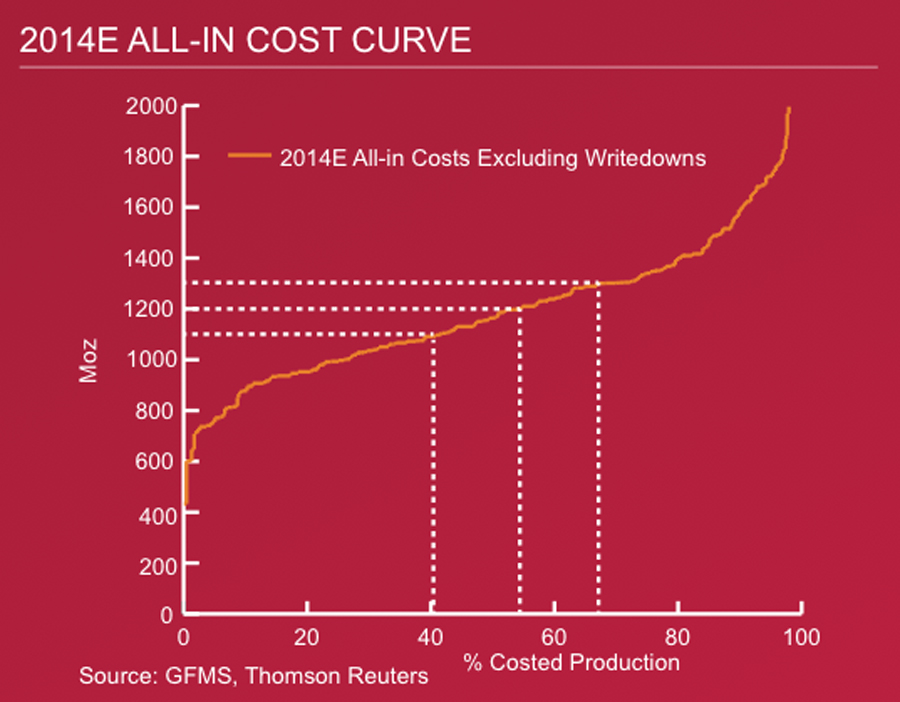
And cost of supply may now be providing that elusive price floor gold bulls have been looking for since 2011's record high above $1,900.
As this chart by metals consultancy GFMS and Thomson Reuters shows towards the $1,100 mark, 60% of the industry would be loss-making on an all-in basis.
Gold miners' problems are only exacerbated say the authors by falling by-product credits, such as silver and copper which are down roughly one third and 10% respectively from the 2013 average.
Average costs in the industry sits around $1,200 and is falling as miners shelve projects, reduce exploration expenditure, defer or cut back on sustaining capital and a strong dollar helps to contain costs outside the US.
While the price may well fall to $1,100 in the year ahead, multiple quarters of prices at these levels would force loss-making miners out of business and reduce supply, helping prices to recover.
Frik Els | December 28, 2014
CHART: $1,200 gold price the new normal? Lion Chrome Smelter in South Africa. Source: Glencore
CHART: $1,200 gold price the new normal?
Lion Chrome Smelter in South Africa. Source: Glencore
After closing 2013 at $1,205 an ounce the price of gold jumped out of the starting gate, rising consistently to reach a high of $1,380 in March.
But the metal failed to consolidate gains during the summer doldrums, falling to a near four-year low November 6 at $1,143.
The recovery from there was swift and gold is heading into the final week of 2014 basically where it started the year.
Gold 2014's highs and lows were 20% or $237 apart, making it the quietest year since 2008. Last year it was 40% or $488 – gold's most volatile 12 months since crazy 1980.
Gold miners' problems are only exacerbated by falling by-product credits
The subdued trading in gold came despite potential market shocks including the slide in oil, the rampant dollar and a variety of geopolitical shocks during 2014.
The gold price is the most sentiment-driven of all commodities, but fundamentals still do matter.
And cost of supply may now be providing that elusive price floor gold bulls have been looking for since 2011's record high above $1,900.
As this chart by metals consultancy GFMS and Thomson Reuters shows towards the $1,100 mark, 60% of the industry would be loss-making on an all-in basis.
Gold miners' problems are only exacerbated say the authors by falling by-product credits, such as silver and copper which are down roughly one third and 10% respectively from the 2013 average.
Average costs in the industry sits around $1,200 and is falling as miners shelve projects, reduce exploration expenditure, defer or cut back on sustaining capital and a strong dollar helps to contain costs outside the US.
While the price may well fall to $1,100 in the year ahead, multiple quarters of prices at these levels would force loss-making miners out of business and reduce supply, helping prices to recover.
 (0)
(0) (0)
(0)
I'm in it to win it!
NASDAQ DIP and RIP
Here is the best word that describes what i do here.
Intuitive;
means having the ability to understand or know something without any direct evidence or reasoning process.
I was born with it, I'm truly blessed!
Alway's searching for winners'
NASDAQ DIP and RIP
Here is the best word that describes what i do here.
Intuitive;
means having the ability to understand or know something without any direct evidence or reasoning process.
I was born with it, I'm truly blessed!
Alway's searching for winners'