SSBN Daily Chart...... Breakout on the way? A
Post# of 2561
Posted On: 09/16/2014 7:03:02 PM

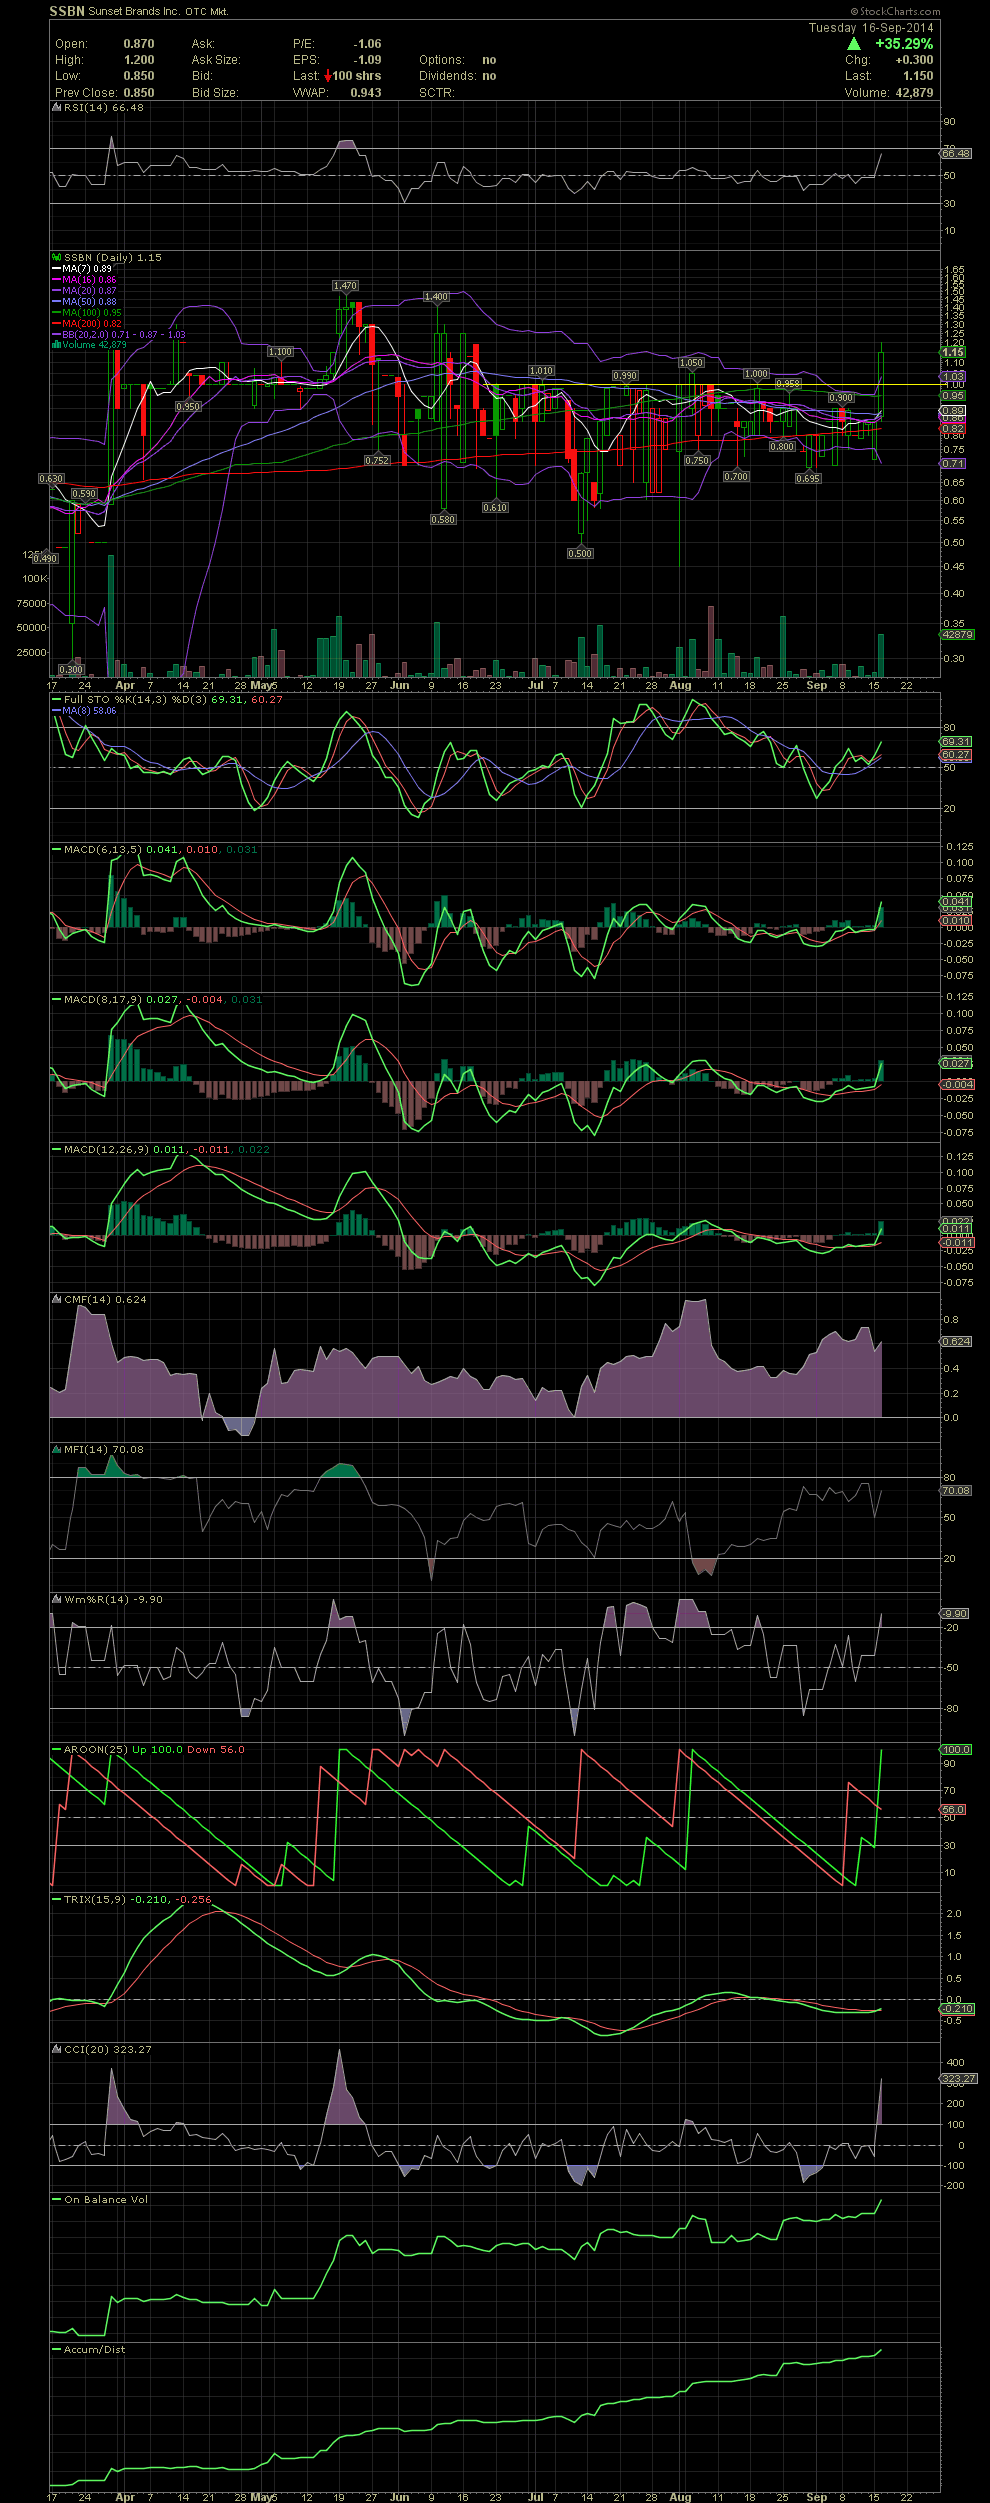
SSBN Daily Chart...... Breakout on the way?
As expected, once the stock began moving over the 1.00/1.05 levels, SSBN might see the beginning of a technical breakout. Strong volume on a large hollow, green candle. FullSto and MACDs confirming with the early stages of a positive crossover. Months of accumulation to the tune of 100's of thousands of shares. With an up day of 35.29% on just 42,879 shares, on can see how difficult it would be to build a position of just 100,000 shares quickly. The move towards much higher numbers started today. Next stop with a close over 1.20 would be the 1.40-1.60s. GLTA
As expected, once the stock began moving over the 1.00/1.05 levels, SSBN might see the beginning of a technical breakout. Strong volume on a large hollow, green candle. FullSto and MACDs confirming with the early stages of a positive crossover. Months of accumulation to the tune of 100's of thousands of shares. With an up day of 35.29% on just 42,879 shares, on can see how difficult it would be to build a position of just 100,000 shares quickly. The move towards much higher numbers started today. Next stop with a close over 1.20 would be the 1.40-1.60s. GLTA
 (0)
(0) (0)
(0)