MPIX Daily Chart......................... Link
Post# of 5570

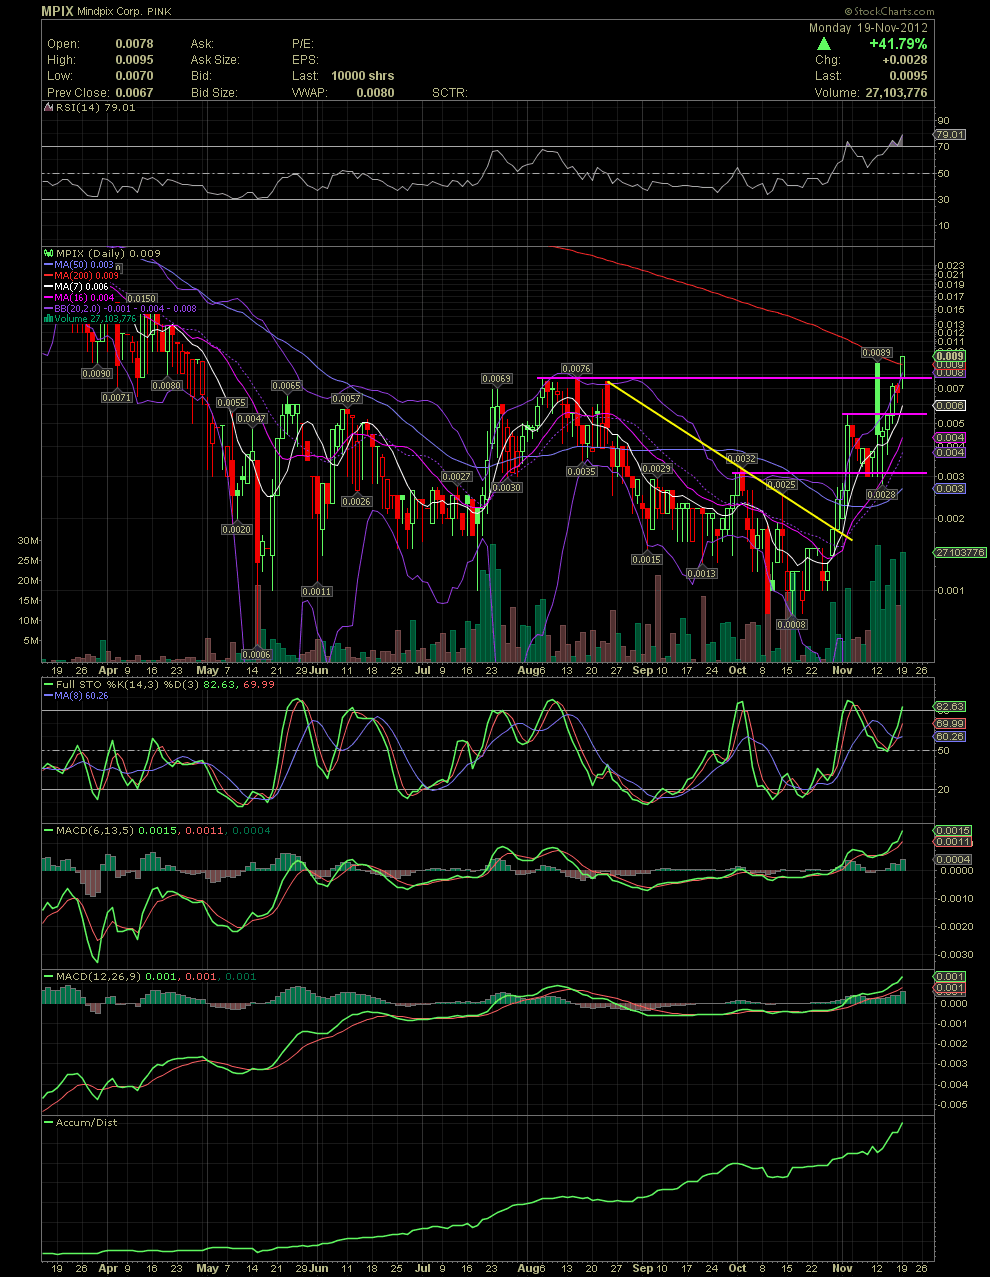
MPIX Daily Chart.........................
Link back to previous, posted charts to follow the sequence of technicals. As mentioned previously, I had hoped that the break above .0054 would bring into play a move and test of the .0076 highs of August. After Sunday's PR, we saw that early on this morning. The next point of resistance followed by many chartist was the MA200 which was at .0089 on Friday's close. Today that longer term moving average was hit early in the trading day. After a pullback to .007, late in the day the stock price moved higher to close above the MA200 with an impressive close of .0095. No doubt the chart is a bit ahead of itself with indicators, such as the RSI and FullSto, entering slightly overbought territory. It wouldn't surprise me to see some profit taking with some consolidation in the .008s and .009s. I was asked if I thought the stock could drop into the .007s again. I really have no idea, but if it does, I think it will be met with aggressive buying as we've seen since the .003/.0032 support level held. Need proof of that? Just check out the volume bars and the A/D line. Whether we see a pullback or not, who knows. I'll post the MPIX 18 Month Chart next for the bigger view of things. Treat the above as my opinion please. GLTA
 (0)
(0) (0)
(0)