Good Evening BioMan and CTIXers I received a re
Post# of 72451

Good Evening BioMan and CTIXers
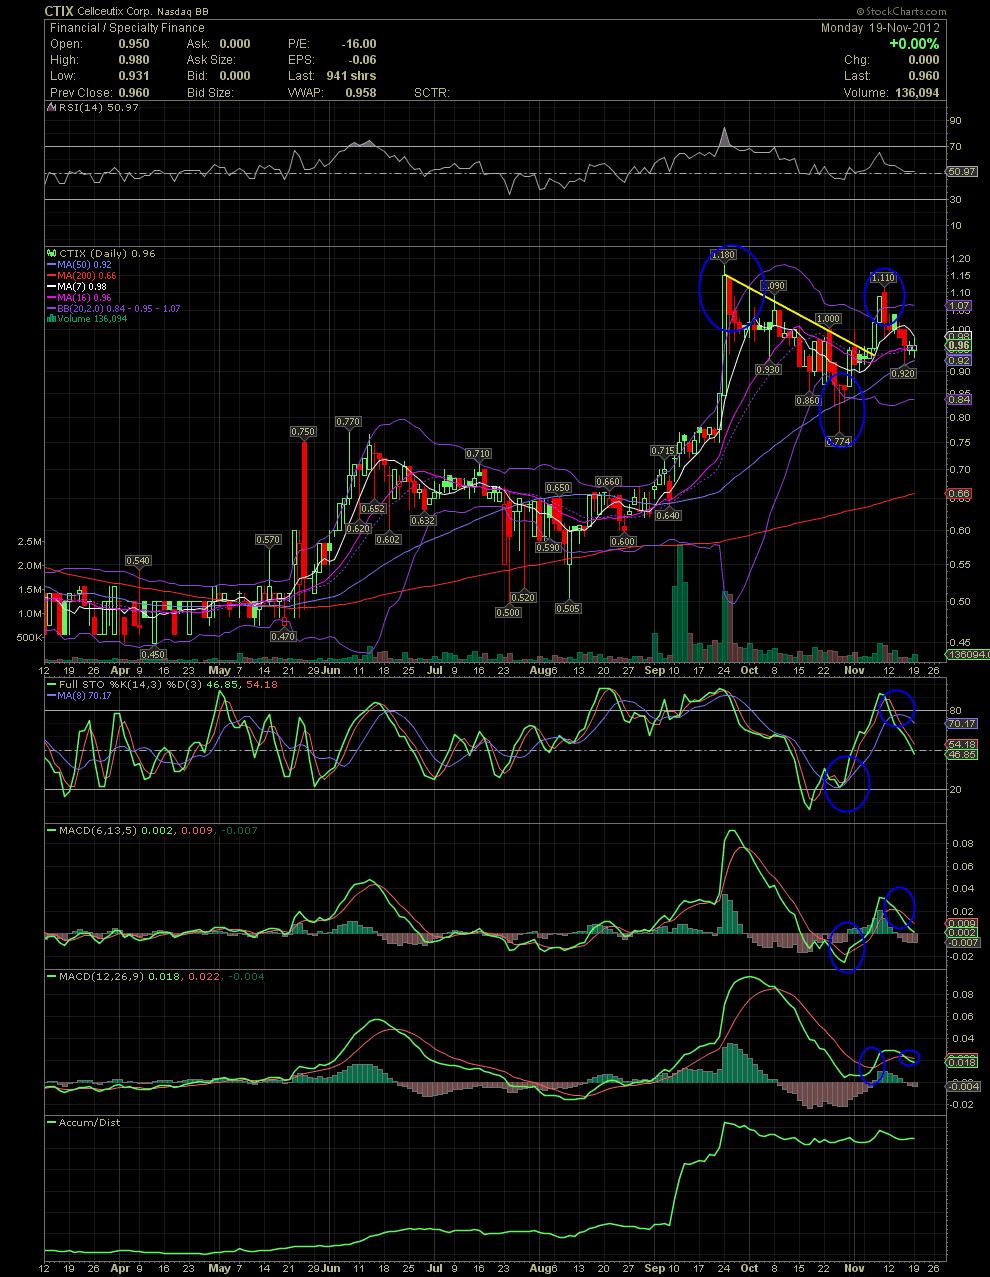
I received a request for a chart this evening, so here you go. If you link back to my last CTIX Daily Charts, you'll see some thoughts on the upper bollie and what always occurs when the stock price moves too far outside of it. On the chart below, those of you that followed along prior to the breakout from .774 to 1.11, can see that move outside the UB. As occurred in late Sept with the move too far outside, the same happened on the move up to 1.11. I've circled the moves of the share price when it ran too far outside to the upside and also one move to the downside and too far outside the lower bollie. Additionally, the same indicators that helped to confirm a buy signal, the FullSto and MACDs, should be watched for reversals with the opposite moves. I circled the low points previously when a breakout was underway. Inversely, you can view the squiggly lines and see what to look for when a correction is about to occur. What I am no watching is for the FullSto and MACDs to begin leveling out and a turn of the green indicator lines to get ready to cross up and over the red signal lines. I would also watch for the moving averages to begin curling up again. At the moment the MA7 is falling. The MA50 is now at .92. Many tech traders use that moving average as an entry if it holds. This chart only has a few of the indicators that I follow, but with just the ones available below, anyone here wishing to learn, needs only to study the various crossovers of the ones I've shared and compare it too the subsequent moves. News always trumps the technicals, but they are a great tool and compliment to one's fundamental analysis. GLTA

 (0)
(0) (0)
(0)