MPIX Daily Chart...... After today's news, I'd be
Post# of 5570

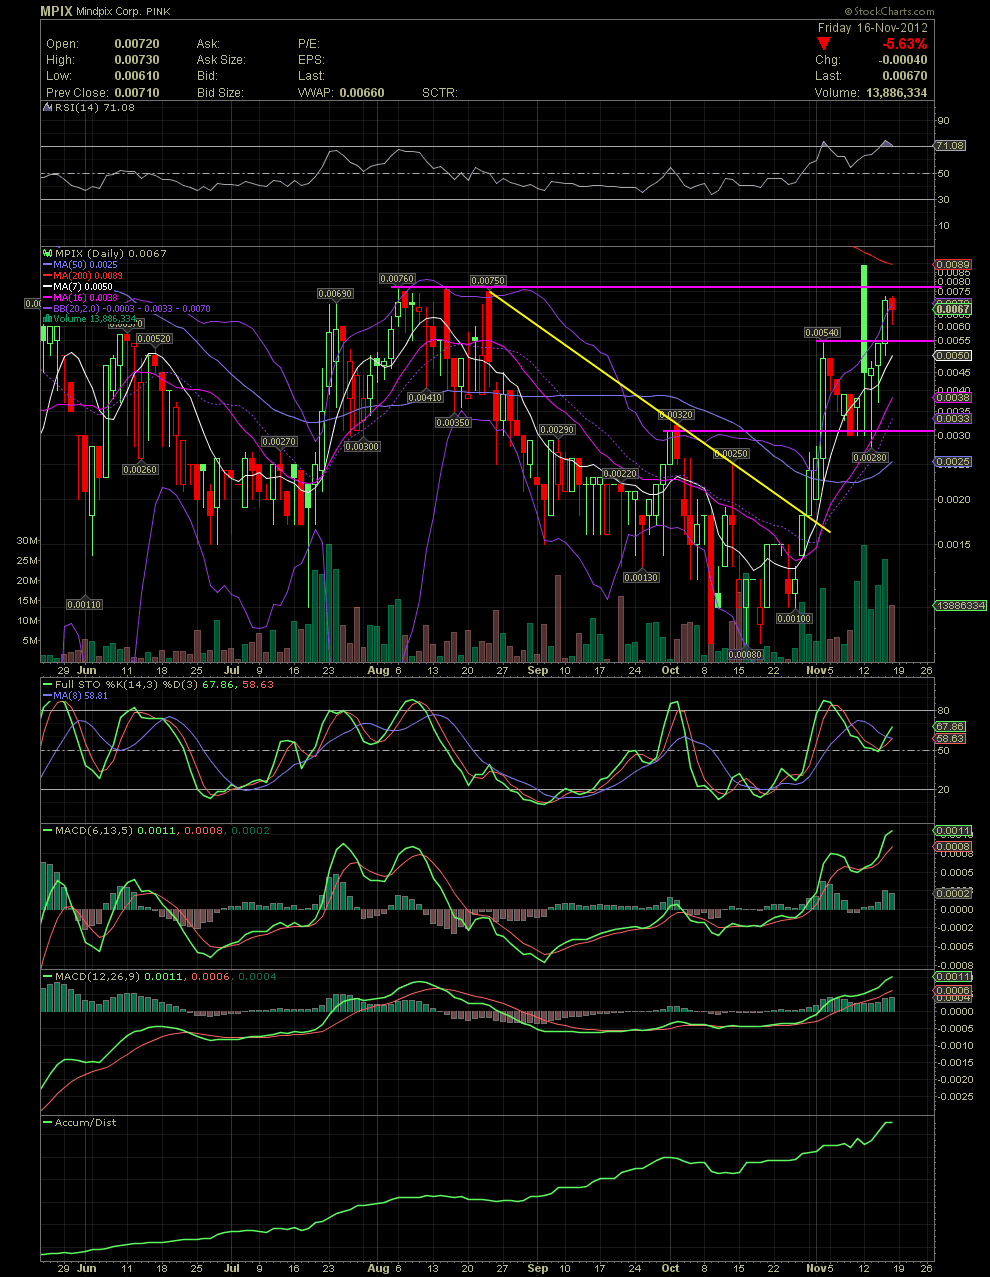
MPIX Daily Chart...... After today's news, I'd be looking at an early entry
The daily chart shows the breakout at the .0015 level which I mentioned her repeatedly as a reversal confirmation. As the share price moved over that price, the volume picked up as did the share price. Once the price ran too far outside the upper bollie in early November, the expected pullback/consolidation, that we spoke about here, held at the .003/.0032 area which was also the high for most of Sept and Oct. Currently, all the short term moving averages, such as the 7, 10, 16, 20, and 50 are all ascending in order. Next up, which I would like to see, would be a move and close above above the highs of July/August of .0076. The MA200, followed by any technical traders with a longer view of things, is at .0089. It would preferable to see that average moving up rather than falling, but that will occur in another 3-4 weeks should the share price move into the low pennies. The would probably also give the longer term investors that Golden Cross which we always hear about. That is a trailing indicator, and by the time we see that happen, those of us invested already will already see a big move. Moving down to the FullSto and MACDs, all are in a buy signal. The FullSto held its 50 line and is now moving up with a renewed buy as is the shorter term MACD. The separation on both MACDs is a good thing. The A/D line, as Emax Man often mentions, it reflecting the months of accumulation of long shareholders. It is a lagging indicator, as it the RSI, and I use neither to time any swing trades.
Although I believe tomorrow MPIX could see .01, it also wouldn't upset me if we saw a short pullback to absorb more flippers. GLTA

 (0)
(0) (0)
(0)