BTX Daily Chart Hi Biomanbaba. Hope you're h
Post# of 41

BTX Daily Chart
Hi Biomanbaba. Hope you're having a good weekend. Here's a couple of charts for you. As I mentioned to you, it's hard to call a bottom until I've seen one established. The charts are tools that help to find potential entries and exits. BTX has been a tough one because it's pretty much been a falling knife. One would have to go back more than 3 years to find a potential level that might offer a reversal.
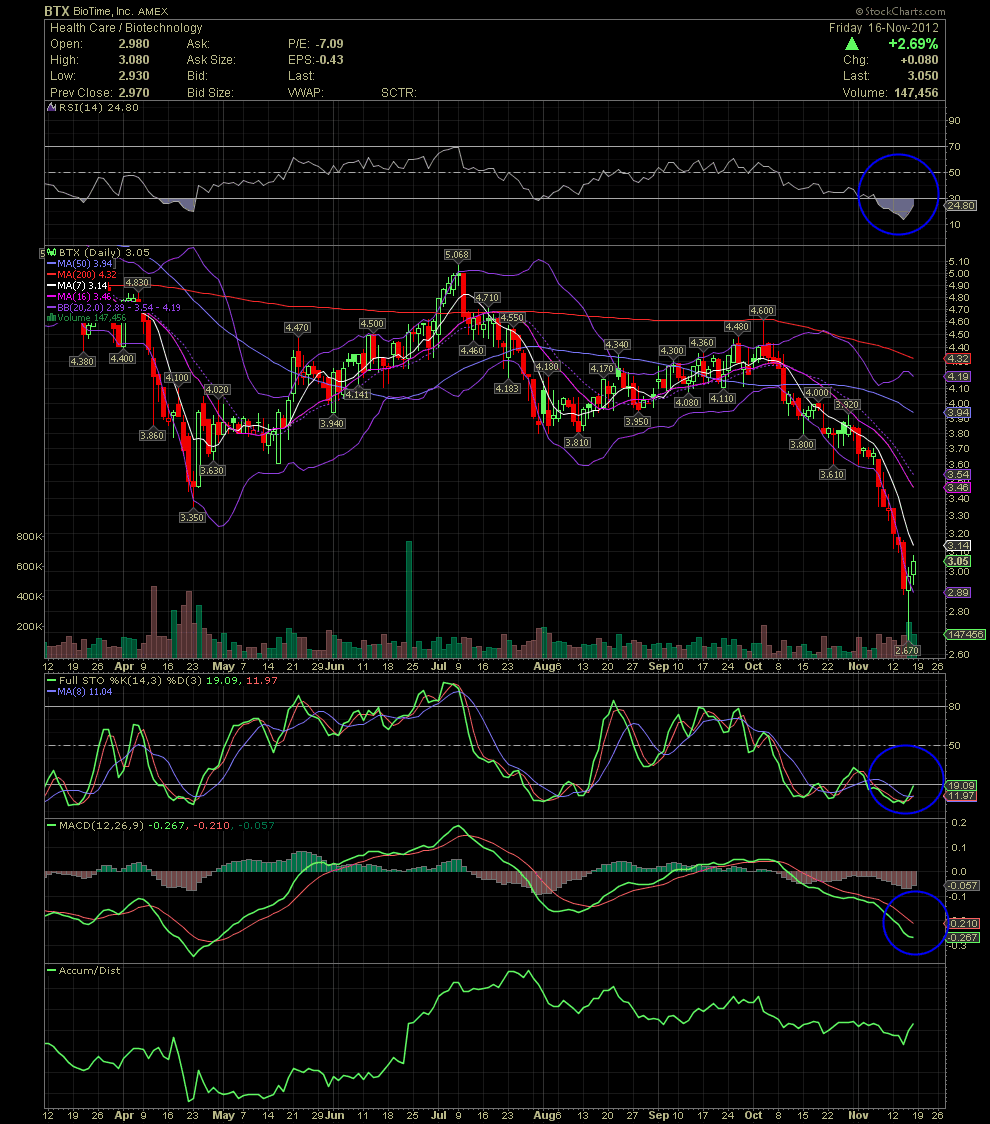
The first chart is a nine month daily. One it, one can see that the FullSto has given a buy signal. The MACD is beginning to level out but not at a buy yet. The FullSto is a much faster indicator. The various moving averages are in a nose dive, so even though BTX bounced nicely off of Thursday's intraday capitulation selloff, we'll have to see if the stock can regain the MAs that I use.
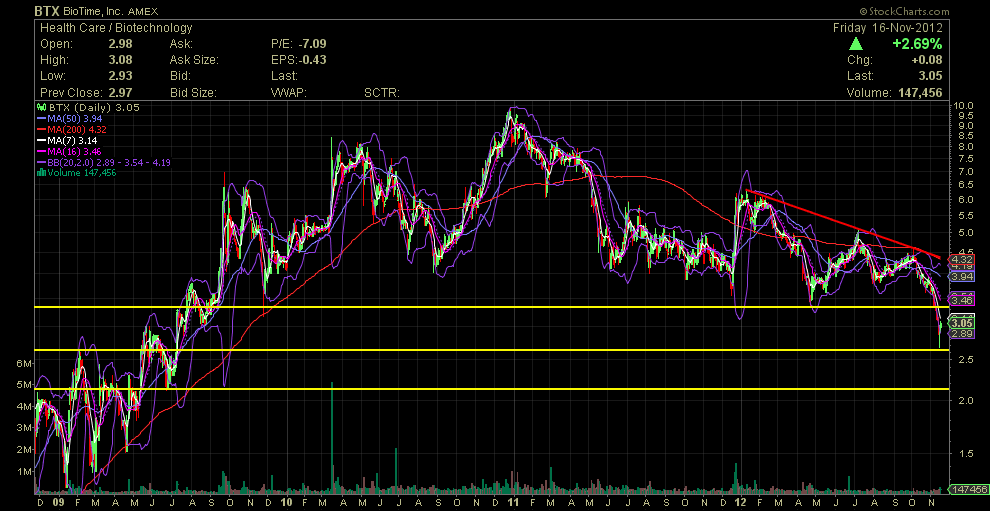
The second chart shows a few horizontal resistance points from over 3 years ago. Those might offer a halt to this decline. So far the first level did hold, but there were quite a few before you asked for a chart that have been cut thru like a hot knife thru butter.


 (0)
(0) (0)
(0)